Reprogramming to recover youthful epigenetic information and restore vision
Ageing is a degenerative process that leads to tissue dysfunction and death. A proposed cause of ageing is the accumulation of epigenetic noise that disrupts gene expression patterns, leading to decreases in tissue function and regenerative capacity1–3. Changes to DNA methylation patterns over time form the basis of ageing clocks4, but whether older individuals retain the information needed to restore these patterns—and, if so, whether this could improve tissue function—is not known. Over time, the central nervous system (CNS) loses function and regenerative capacity5–7. Using the eye as a model CNS tissue, here we show that ectopic expression of Oct4 (also known as Pou5f1), Sox2 and Klf4 genes (OSK) in mouse retinal ganglion cells restores youthful DNA methylation patterns and transcriptomes, promotes axon regeneration after injury, and reverses vision loss in a mouse model of glaucoma and in aged mice. The beneficial effects of OSK-induced reprogramming in axon regeneration and vision require the DNA demethylases TET1 and TET2. These data indicate that mammalian tissues retain a record of youthful epigenetic information—encoded in part by DNA methylation—that can be accessed to improve tissue function and promote regeneration in vivo.
The metaphor of the epigenetic landscape, first invoked by Waddington to explain embryonic development8, is increasingly seen as relevant to the other end of life9. Evidence from yeast and mammals supports an Information Theory of Ageing10,11, in which the loss of epigenetic information disrupts youthful gene expression patterns1–3, leading to cellular dysfunction and senescence12,13.
DNA methylation patterns are laid down during embryonic development to establish cell type and function. During ageing, for reasons that are unclear, these patterns change in ways that can be used to calculate DNA methylation (DNAm) age, a representation of biological age that can predict future health and lifespan4. In cell culture, the ectopic expression of the four Yamanaka transcription factors Oct4, Sox2, Klf4, and c-Myc (OSKM) can reprogram cultured somatic cells to become pluripotent stem cells14, a process that erases cellular identity and resets DNAm age4,15. In a premature ageing mouse model of Hutchinson-Gilford progeria syndrome (HGPS), cyclic transgene-mediated expression of these four genes alleviates symptoms and extends lifespan, raising the possibility that OSKM might counteract normal ageing, too16. Continuous expression of all four factors in normal mice, however, often induces teratomas17–19 or is fatal within days16, ostensibly due to tissue dysplasia18.
Ageing is generally considered a unidirectional process akin to an increase in entropy. Living systems, however, are open not closed, and in some cases can fully reset biological age, examples being “immortal” jellyfish and the cloning of animals by nuclear transfer. Having previously found evidence for epigenetic noise as an underlying cause of ageing3,13, we wondered whether mammalian cells might retain a faithful copy of epigenetic information from earlier in life that could serve as instructions to reverse ageing10.
Reset of ageing signatures, not identity
Our first goal was to find a way to reset the epigenome without erasing cell identity. Among the Yamanaka factors, c-Myc is an oncogene that reduces mouse lifespan20 and is not required for the initiation of cellular reprogramming21. Therefore, we excluded c-Myc from our experiments, expressing only Oct4, Sox2, and Klf4 (OSK) in fibroblasts from old mice and monitoring the effect on genes known to be altered with age, including H2A, H2B, LaminB1, and Chaf1b13. Even without c-Myc, expression of OSK for five days promoted youthful mRNA profile, with no apparent loss of cellular identity or the induction of Nanog, a transcription factor indicative of pluripotency and oncogenicity (Extended Data Fig. 1a–c).
Next we tested the long-term safety of ectopically expressing OSK in vivo. To deliver and control OSK expression in mice, we engineered a dual adeno-associated virus (AAV) system under the tight control of a tetracycline response element (TRE) promoter (Fig. 1a). The TRE promoter can be activated either by reverse tetracycline-controlled transactivator (rtTA) in the presence of the tetracycline derivative doxycycline (DOX) (‘Tet-On’) or by tetracycline-controlled transactivator (tTA) in the absence of DOX (‘Tet-Off’). Extraneous AAV sequences were removed from the vector to accommodate OSK as a poly-cistron. To test if AAV-mediated OSK expression was toxic in vivo, we co-infected young (5-month-old) and aged (20-month-old) mice with AAV9-rtTA;TRE-OSK via intravenous delivery. OSK expression was then induced by providing Dox in the drinking water, the rationale being that AAV9’s weak tropism for the digestive system might avoid the dysplasia and weight loss seen in transgenic mouse models18 (Extended Data Fig. 1d–i). After 10–18 months of continuous OSK induction, no increase in tumor incidence or negative effects on overall health were observed, indicating that cellular identity was maintained in OSK-expressing cells (Extended Data Fig.1 j–n).
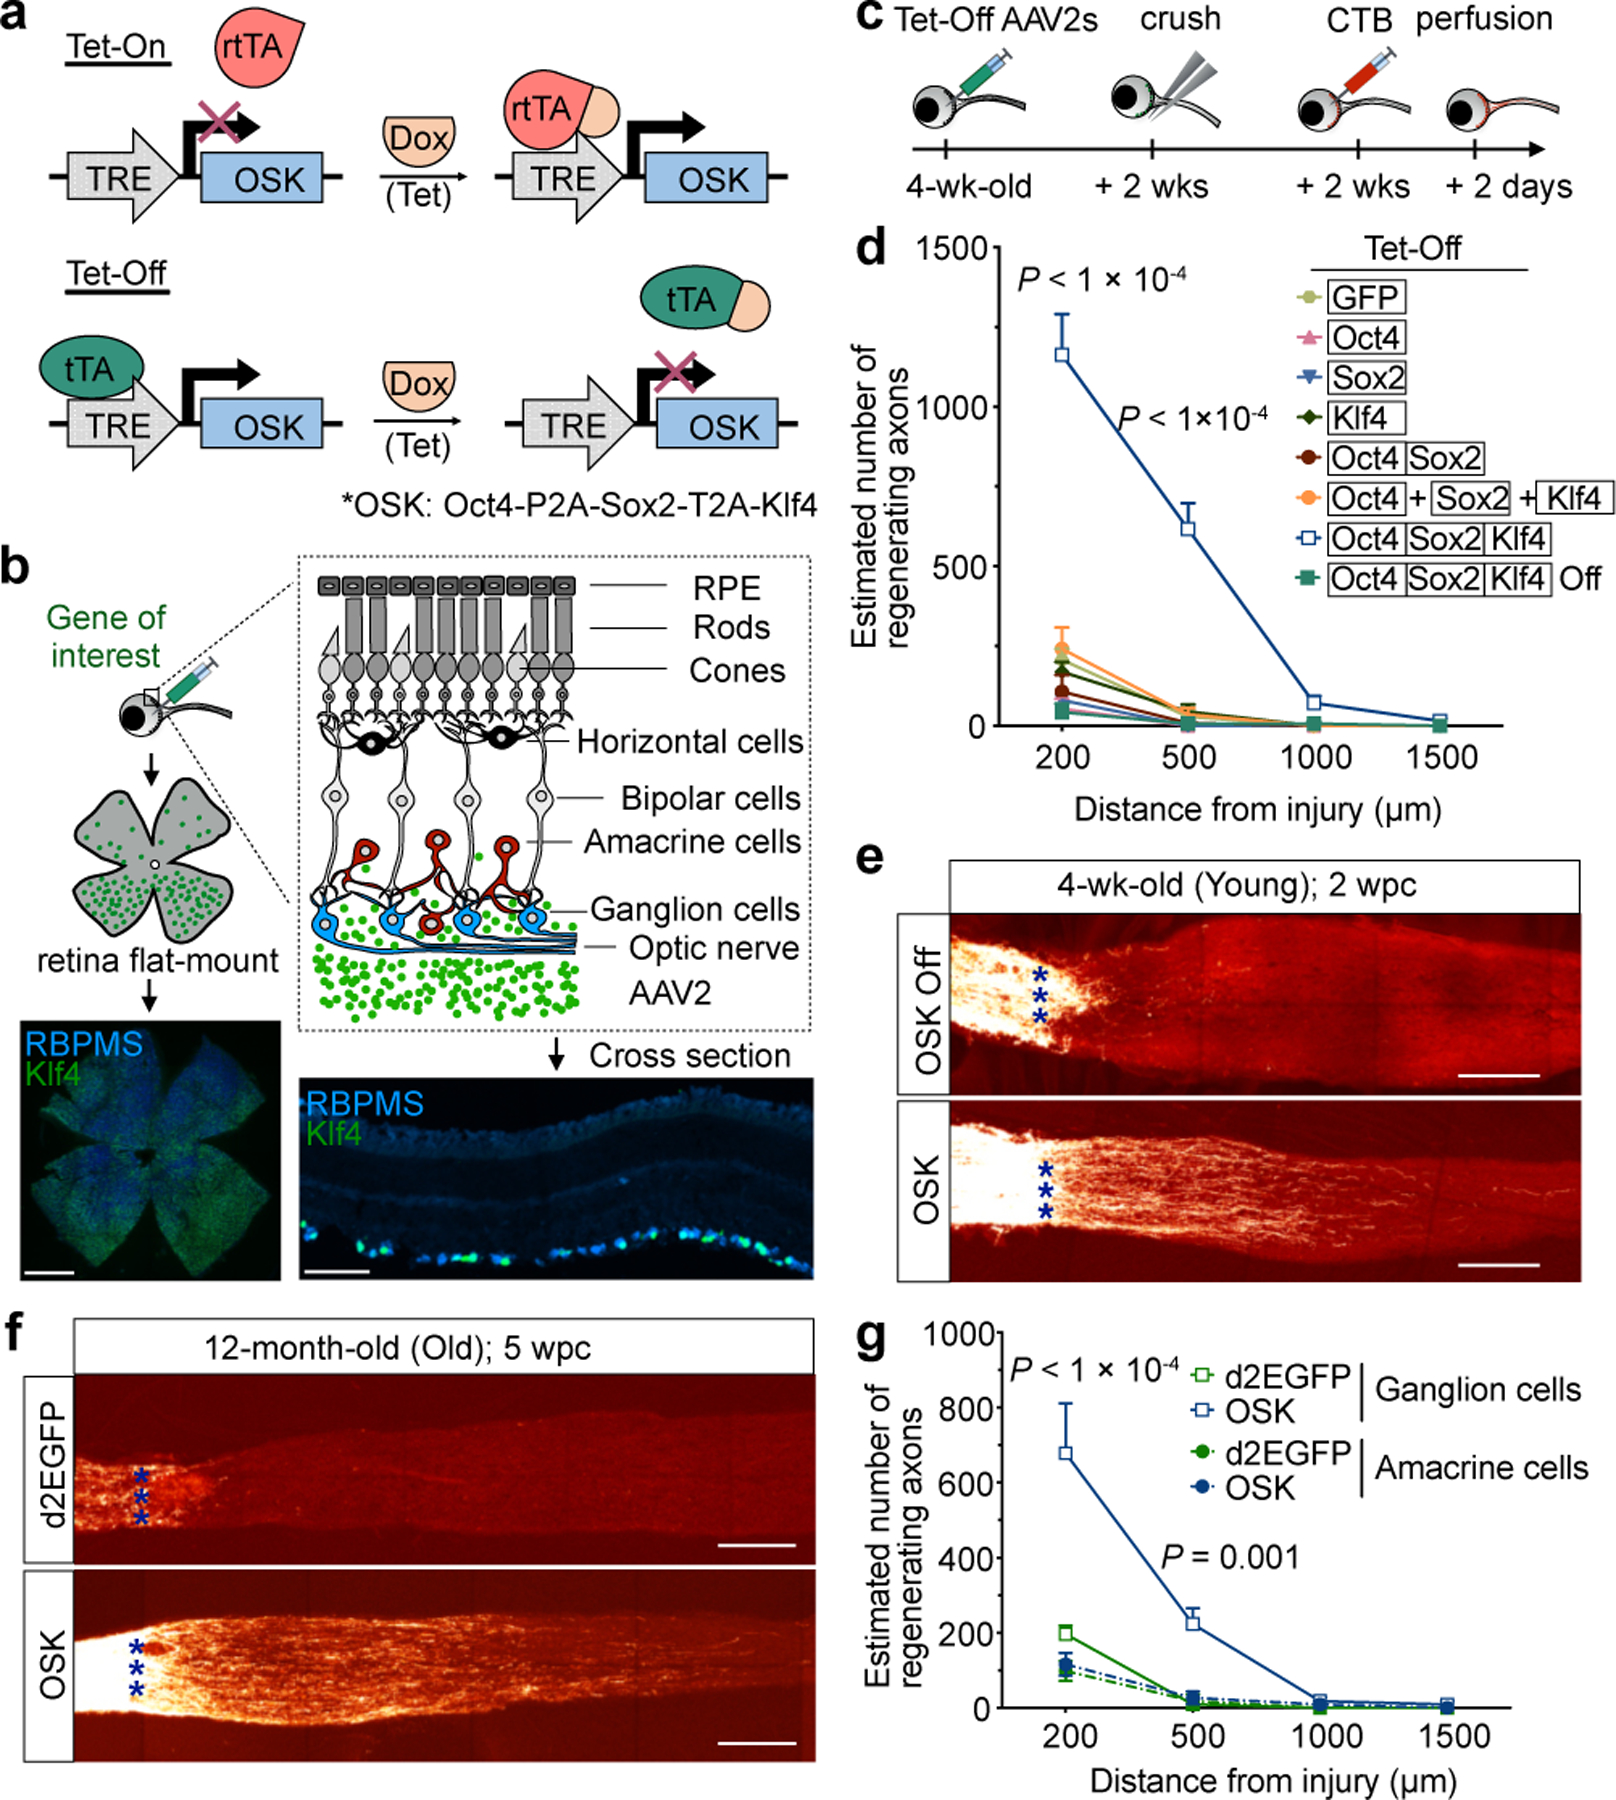
AAV2-delivered polycistronic OSK promotes axon regeneration and RGC survival following optic nerve injury.
a, Schematic of the Tet-On and Tet-Off dual AAV vectors. b, Schematic and representative retinal wholemount/cross sections (n = 10), two weeks after intravitreal injection of AAV2-tTA;TRE-OSK showing Klf4 (green) expression in the RGCs (RBPMS+, blue). Scale bars, 1 mm and 100 µm, respectively. c, Experimental outline of the optic nerve crush study using the Tet-Off system. 555-CTB was used for anterograde axonal tracing. wks, weeks. d, Number of axons 16 days after crush injury at distances distal to the lesion in mice treated with either AAV2 encoding destabilized enhanced green fluorescent protein (d2EGFP), Oct4, Sox2, Klf4, Oct4-Sox2, or OSK on three monocistronic AAV2s or a single polycistronic AAV2 (n = 5, 4, 4, 4, 4, 4, and 7 eyes). Suppression of polycistronic OSK expression by Dox (n = 5 eyes) is shown as OSK Off in d and e. e, Representative images of longitudinal sections through optic nerves after receiving intravitreal injections of AAV2-tTA;TRE-OSK in the presence (n = 5) or absence of doxycycline (n = 7). CTB-labeled axons are shown 16 days post crush (dpc). Asterisks indicate optic nerve crush site. f, Representative confocal images of longitudinal sections through the optic nerve showing CTB-labeled axons in 12-month-old mice, 5 weeks post-crush (wpc), with AAV2-mediated expression of either GFP or OSK. Representative results from n = 5 eyes. g, At 16 dpc, the number of axons at multiple distances distal to the lesion site in transgenic Cre lines that selectively express OSK either in RGCs (Vglut2-CRE) or amacrine cells (Vgat-CRE) with intravitreal injection of AAV2-FLEx-tTA;TRE-OSK (n = 4 eyes each condition). Details in Extended Data Fig. 4e–h. Scale bars, 200 µm. One-way ANOVA with Bonferroni correction in d and g, with comparisons to d2EGFP shown in f. All data are presented as mean ± s.e.m.
OSK stimulates axon regeneration
During ageing, almost all species experience a decline in regenerative potential. In mammals, one of the first systems to lose regenerative potential is the CNS5–7. Retinal ganglion cells (RGCs) of the CNS project axons away from the retina to form the optic nerve. If damaged, RGCs of embryos and neonates can regenerate axons, but this capacity is lost within days after birth, likely due to a molecular program intrinsic to the RGCs6,22. Attempts to reverse optic nerve damage have been only moderately successful, with no treatments able to restore eyesight either in late-stage glaucoma or in old age23.
To test whether it is possible to provide adult RGCs with the regenerative capacity of younger RGCs, we induced OSK in an optic nerve crush injury model. For retinal gene delivery, Tet-Off AAV2s carrying OSK as a single polycistron were injected into the vitreous body, resulting in Dox-responsive gene expression in around 40% of RGCs, as estimated by immunostaining (Fig. 1b, Extended Data Fig. 2a, ,b).b). Even after 15 months of continuous induction, OSK expression did not induce any tumors or structural changes in the retina (Extended Data Fig. 2c–i, Supplementary Videos).
In a separate cohort, RGCs were infected with Tet-Off AAV2 and optic nerve crush was performed two weeks later (Fig. 1c). After another two weeks, Alexa Fluor 555-conjugated cholera toxin subunit B (CTB), an anterograde axonal tracer, was delivered by intravitreal injection to quantify axon regeneration. Independent of RGC proliferation (Extended Data Fig. 3a, ,b),b), the greatest extent of axon regeneration and RGC survival occurred when all three genes were delivered and expressed as a polycistron within the same AAV particle (Fig. 1d, ,e).e). Strikingly, when polycistronic OSK was induced for 12–16 weeks, regenerating and sprouting RGC axon fibers extended over 5 mm into the chiasm, where the optic nerve connects to the brain (Extended Data Fig. 3c, ,d).d). Suppression of polycistronic OSK by Dox treatment prevented both regenerative and survival effects (Fig. 1d, ,e,e, Extended Data Fig. 3e).
When Oct4, Sox2, and Klf4 were co-delivered via separate monocistronic AAVs, no effect on axon regeneration was observed, ostensibly due to the lower frequency of co-infection or inconsistent stoichiometry (Fig. 1d, Extended Data Fig. 3f–i). When delivered singly, Oct4 or Sox2 alone increased RGC survival slightly (Extended Data Fig. 3e), but none of the single factors alone had any effect on regenerative capacity (Fig. 1d). Because Klf4 can repress rather than promote axonal growth24, we tested a dual-cistron of only Oct4 and Sox2 and observed no regenerative effect.
Many regenerative approaches that work well in young individuals often fail in older ones25,26. In 12-month-old mice, OSK treatment doubled RGC survival, similar to what was observed in 1- and 3-month-old mice (Extended Data Fig. 4a). Though axon regeneration was slightly weaker in the older mice (Extended Data Fig. 4b), when treatment was extended for three more weeks (5 weeks post crush; wpc), robust axon regeneration still occurred, with no increase in RGC number (Fig. 1f, Extended Data Fig. 4c, ,d).d). These data indicate that ageing does not greatly diminish the ability of OSK to induce axon regeneration.
To test whether OSK was acting directly on RGCs or via amacrine cells27, the other type of retinal cells that AAV2 can infect following intravitreal injection, we introduced tTA in double-floxed inverse orientation (AAV2-FLEx-tTA) with AAV2-TRE-OSK into two Cre transgenic mouse lines, so that OSK selectively expressed either in RGCs (Vglut2-CRE) or amacrine cells (Vgat-CRE) (Extended Data Fig. 4e, ,f).f). OSK expression in RGCs alone promoted axon regeneration, whereas expression in amacrine cells did not (Fig. 1g, Extended Data Fig. 4g, ,h).h). The survival frequency of OSK-positive RGCs was roughly three times that of nearby OSK-negative cells or that of RGCs in GFP-expressing retinas, resulting in a greater relative abundance post-injury (Extended Data Fig. 4i–k). Thus, the ability of OSK to increase survival appears to be mediated within the RGC and is largely cell-autonomous. The mRNA levels of Stat3, a pro-regeneration gene28, robustly increased in response to OSK and was maintained post-injury (Extended Data Fig. 5a, Supplementary Table 1). Stat3 upregulation, however, does not appear to be mediated by PTEN-mTOR-S6K and SOCS3, two canonical Stat3 regulatory pathways that affect RGC axon regeneration29,30 (Extended Data Fig. 5b, ,c,c, Supplementary Table 1).
OSK counters injury-induced DNAm ageing
Currently, there is no known treatment that can induce robust RGC axon regeneration when started after crush injury. Using our Tet-On AAV system, which rapidly induces OSK expression (Fig. 2a, Extended Data Fig. 2b and and5d,5d, ,e),e), we observed significant improvement in axon regeneration and RGC survival, even when OSK was induced post-injury. The longer the duration of the OSK induction, the greater the distance the axons extended, with no sign of RGC proliferation (Fig. 2b, ,c,c, Extended Data Fig. 5f).
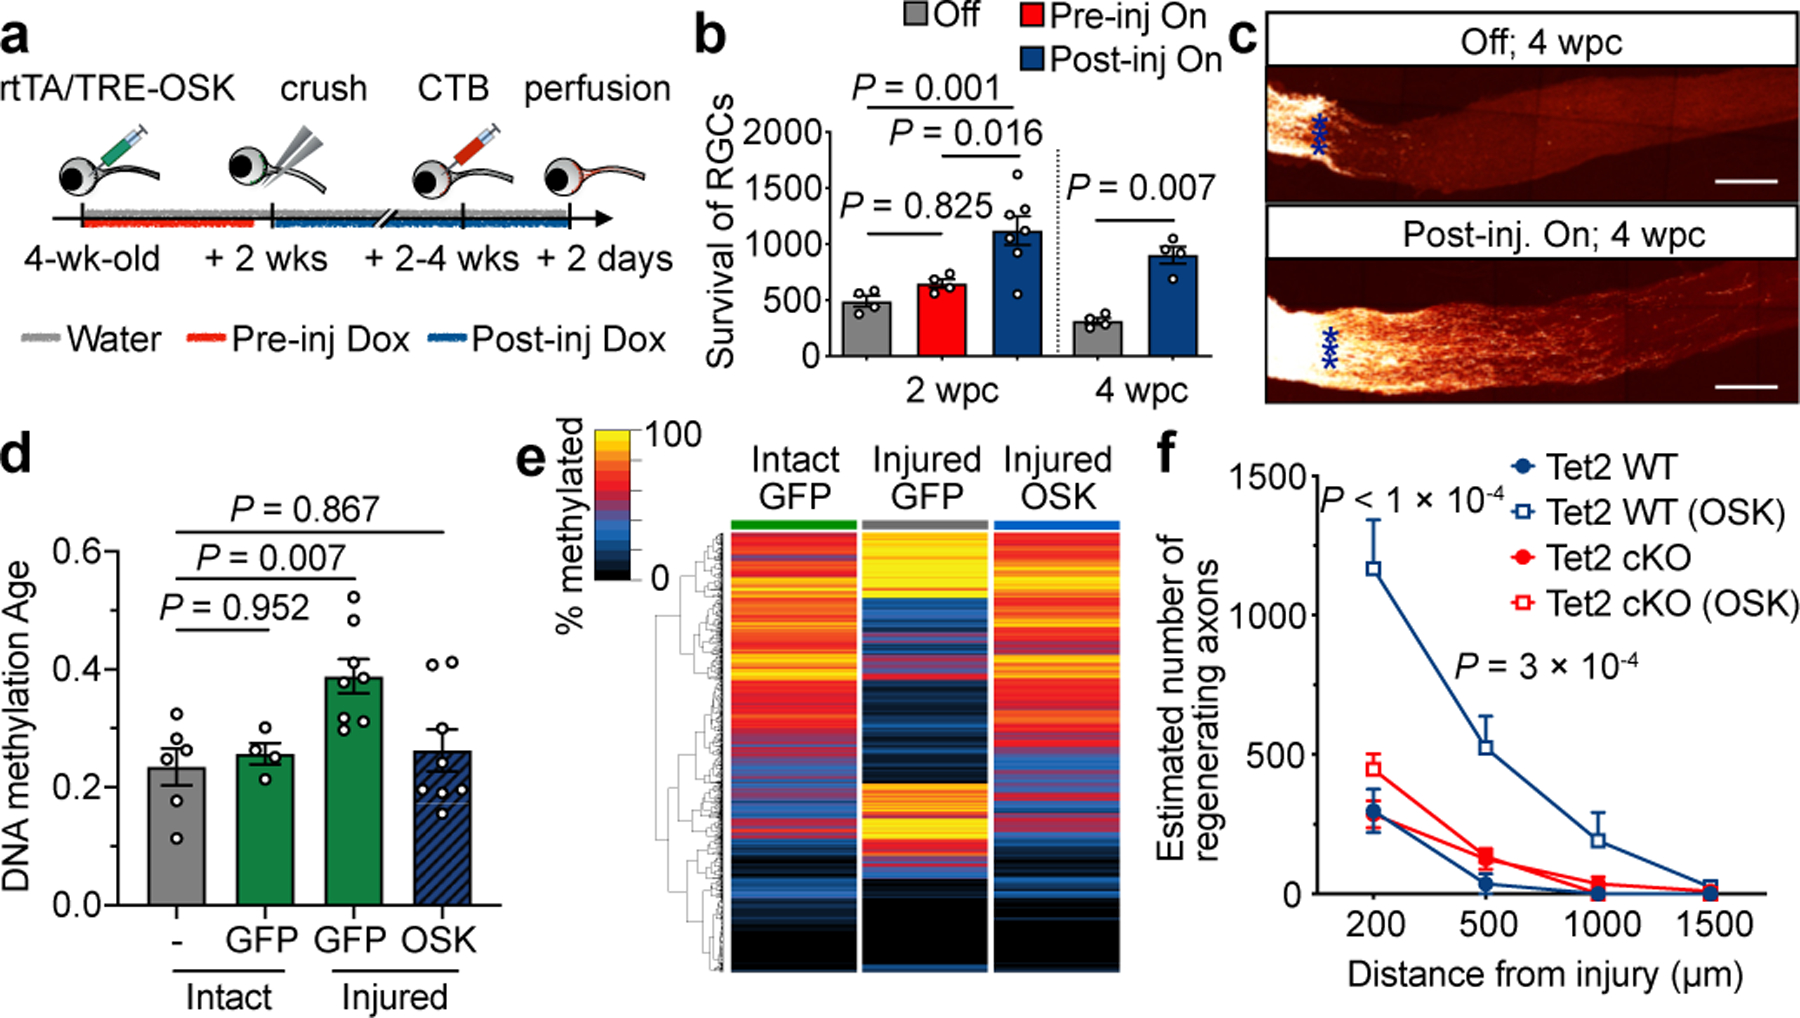
DNA demethylation is required for OSK-induced axon regeneration post injury.
a, Strategies for induction of OSK pre- and post-injury. b, RGC survival per mm2 at 2 and 4 wpc in response to OSK induction either pre- or post-injury (n = 4 eyes except for Post-inj On group, 2 wpc, n = 7 eyes). c, Representative longitudinal sections through the optic nerve showing CTB-labeled axons at 4 wpc, with or without post-injury induction of OSK. Asterisks indicate optic nerve crush site. Representative results from n = 4 eyes. Scale bars, 200 µm. d, ribosomal DNAm age (mo, month) of 6-week-old RGCs isolated from axon-intact retinas infected with or without GFP-expressing AAV, or from axon-injured retinas infected with GFP- or OSK-expressing AAV at 4 dpc (n = 6, 4, 8, and 8 eyes). DNA methylation age estimates of neurons tend to be lower than their chronological ages but remain correlated (see Extended Data Fig. 5g and Methods). e, Hierarchical clustered heatmap of DNA methylation levels of CpGs that significantly changed in RGCs after crush injury (GFP vs Injured GFP, q < 0.05) and the effect of OSK at 4 dpc. f, Axon regeneration in response to OSK expression (AAV2-tTA; TRE-OSK), 16 dpc in Tet2flox/flox mice infected with saline (Tet2 WT, n = 3 each condition) or AAV2-Cre (Tet2 cKO, n = 4 each condition). One-way ANOVA with Bonferroni’s multiple comparison test in b, d, and f. All bar graphs are presented as mean ± s.e.m.
Given the effectiveness of OSK post-injury and the ability of Yamanaka factors to reverse DNAm age in vitro4,15,31,32, we speculated that OSK might have been able to regenerate axons by counteracting the effect of injury on DNA methylation. The DNAm age of RGCs was calculated based on a ribosomal DNA methylation clock33, which provided the best site coverage (67/72 CpG sites) and was highly correlated with chronological age (Extended Data Fig. 5g). Day 4-injured RGCs experienced an acceleration of DNAm age, while OSK expression counteracted this effect (Fig. 2d). Patterns of global DNA methylation were also altered by injury in a way similar to ageing, without affecting average DNA methylation levels (Extended Data Fig. 5h, ,i).i). Strikingly, OSK reversed the global DNA methylation changes caused by injury, with enrichment at genes associated with light detection and synaptic transmission (Fig. 2e, Extended Data Fig. 5j, ,kk).
Regeneration requires DNA demethylation
Next, we asked whether the DNA methylation changes induced by OSK are necessary for RGC survival and axon regrowth. DNA demethylation is catalyzed by ten-eleven-translocation methylcytosine dioxygenases (TET1–3), either passively through DNA replication or actively, even in non-replicating cells, by reversion to cytosine via thymine DNA glycosylase (TDG)34. Because Tet1 and Tet2, but not Tet3, were upregulated by OSK35,36 (Extended Data Fig. 6a), we tested the effect of knocking down Tet1 or Tet2 (sh-Tet1 or sh-Tet2) using AAV37 in the context of damaged, OSK-treated RGCs (Extended Data Fig. 6b–d).
The knockdown of either Tet1 or Tet2 blocked the ability of OSK to increase Stat3 mRNA levels and promote RGC survival and axon regeneration (Extended Data Fig. 6e–g). Knocking out Tet2 in RGCs by delivering AAV2-Cre30 intravitreally to Tet2flox/flox mice also abrogated the increase in regeneration and survival (Fig. 2f, Extended Data Fig. 6h–j). While OSK-expressing RGCs showed no evidence of DNA replication by BrdU (Extended Data Fig. 3a, ,b)b) and knockdown of TDG38 completely abolished the beneficial effects of OSK (Extended Data Fig. 7a–d), a global reduction of DNA methylation mediated by overexpression of the Tet1 catalytic domain39 had no protective or regenerative effect (Extended Data Fig. 7e–h). These data indicate that active DNA demethylation is necessary for OSK, but not sufficient by itself, to protect RGCs and regenerate axons (Extended Data Fig. 7i).
Axon regeneration in human neurons
Paralleling the mouse RGC data, OSK expression in differentiated human neurons effectively counteracted axonal loss and the advancement of DNAm age induced by vincristine, a chemotherapeutic drug that induces axon injury, in the absence of cell proliferation or global DNA demethylation (Extended Data Fig. 8a–g). Nine days after damage, the neurite area was 15-fold greater in the rejuvenated OSK-transduced cells compared to controls (Extended Data Fig. 8h, ,ii).
OSK-mediated recovery of neurite area, as well as both the number and length of axons, were blocked by Tet2 knockdown, but not by mTOR-S6K inhibition (Extended Data Fig. 8j–s). Again, overexpression of the Tet1 catalytic domain on its own failed to promote axon regeneration (Extended Data Fig. 8t). Thus, the ability of OSK to reprogram neurons and promote axon growth in a Tet2-dependent manner appears to be conserved in both mice and humans.
Recovery of vision in mice with glaucoma
We then tested whether OSK induction could restore the function of RGCs in a disease setting. Glaucoma is a leading cause of age-related blindness worldwide, characterized by a progressive loss of RGCs and their axons and often coinciding with increased intraocular pressure (IOP). Elevated IOP was induced unilaterally for 21 days by injection of microbeads into the anterior chamber (Fig. 3a, ,bb)40, with saline injections serving as non-glaucomatous controls. At the 4-week time point, after a significant decrease in axonal density and the number of RGCs (baseline, Extended Data Fig. 9a, ,b),b), AAVs were injected intravitreally and OSK expression was induced for another 4 weeks (Fig. 3a). Compared to glaucomatous eyes that received either PBS or AAVs with no OSK induction (−OSK), the OSK-treated glaucomatous eyes (+OSK) presented with a restoration in axon density equivalent to that in the non-glaucomatous eyes, with no evidence of RGC proliferation (Extended Data Fig. 9c, ,dd).
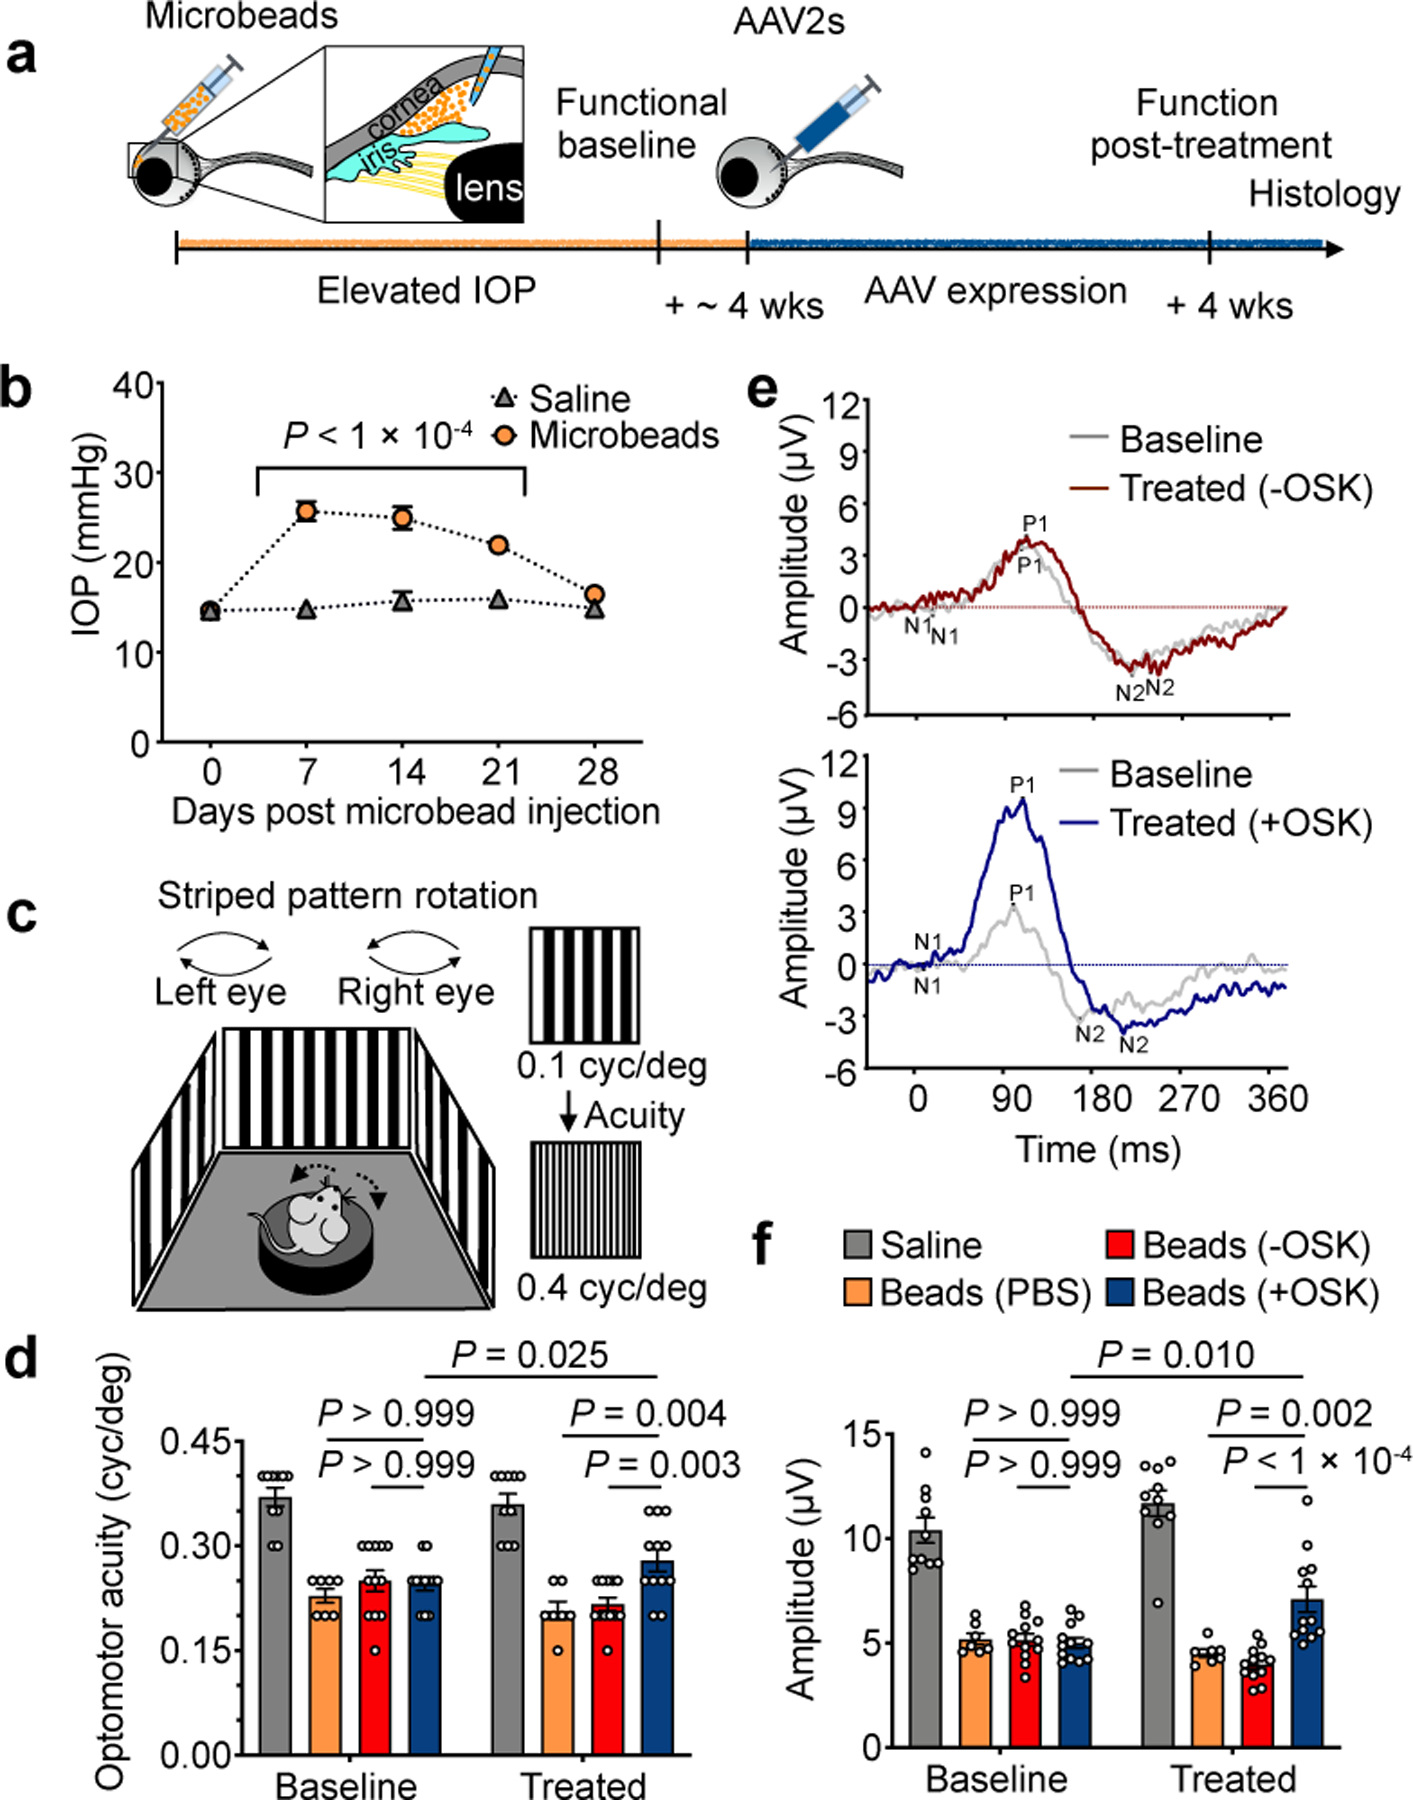
Four weeks of OSK expression reverses vision loss after glaucomatous damage has already occurred.
a, Experimental outline of the induced glaucoma studies using 8-wk-old mice. wks, weeks. b, Intraocular pressure (IOP) measured weekly by rebound tonometry for the first 4 weeks post-microbead/saline injection (saline, n = 10 mice; microbeads, n = 29 mice). c, High-contrast visual stimulation to measure optomotor response. Reflexive head movements were tracked in response to the rotation of a moving stripe pattern that increased in spatial frequency (cyc/deg, cycle per degree). d, Optomotor response of each mouse before treatment and 4 weeks after intravitreal injection of AAVs (n = 10, 7, 12, and 12 mice; similar results from 3 independent experiments combined). e, Representative PERG waveforms in response to a reversing contrast checkerboard pattern, recorded from the same eye both at pre-injection baseline and at 4 weeks after −OSK (upper graph) or +OSK (lower graph) AAV injection. f, Mean PERG amplitudes of recordings from each mouse in d at baseline before treatment and 4 weeks after intravitreal AAV injection (n = 10, 7, 12, and 12 mice; similar results from 3 independent experiments combined). −OSK (not induced): AAV2-rtTA;TRE-OSK; +OSK (induced): AAV2-tTA;TRE-OSK. Two-way ANOVA with Bonferroni correction between groups was used for b; Two-way mixed ANOVA with Bonferroni correction between groups was used for the overall effect of time and treatment for d, and f; before and after treatments were analyzed using a paired two-tailed Student’s t-test in d and f. Data in b, d, and f are presented as mean ± s.e.m.
The OSK-treated eyes also experienced a significant increase in visual acuity relative to the pre-treatment function baseline, restoring about half of visual acuity in the optomotor response (OMR) assay (Fig. 3c, ,d).d). A similar improvement associated with OSK expression was also seen in pattern electroretinogram (PERG) analysis (N1+P1), a readout of electrical waves generated specifically by RGCs (Fig. 3e, ,f).f). To our knowledge, this is the first example of vision loss reversal after glaucomatous injury has occurred, with previous attempts focusing on neuroprotection delivered at an early stage to prevent further disease progression41,42 (Supplementary discussion).
Restoration of vision in old mice
The finding that OSK induction could effectively restore the DNAm age of RGCs after injury indicated that vision loss caused by natural ageing might be reversible too. To test this, we treated 3- and 11-month-old mice with −OSK or +OSK AAVs and induced OSK for 4 weeks (Fig. 4a). OMR and PERG measurements were then carried out. In the absence of OSK induction, there was a significant reduction in visual acuity and RGC electrical activity by one year of age, a loss that was restored by OSK induction (Fig. 4b, Extended Data Fig. 9e). Restoration of visual acuity was not seen in 18-month-old mice (Extended Data Fig. 9e, ,f),f), likely because an age-dependent increase in corneal opacity43 interfered with assessment.
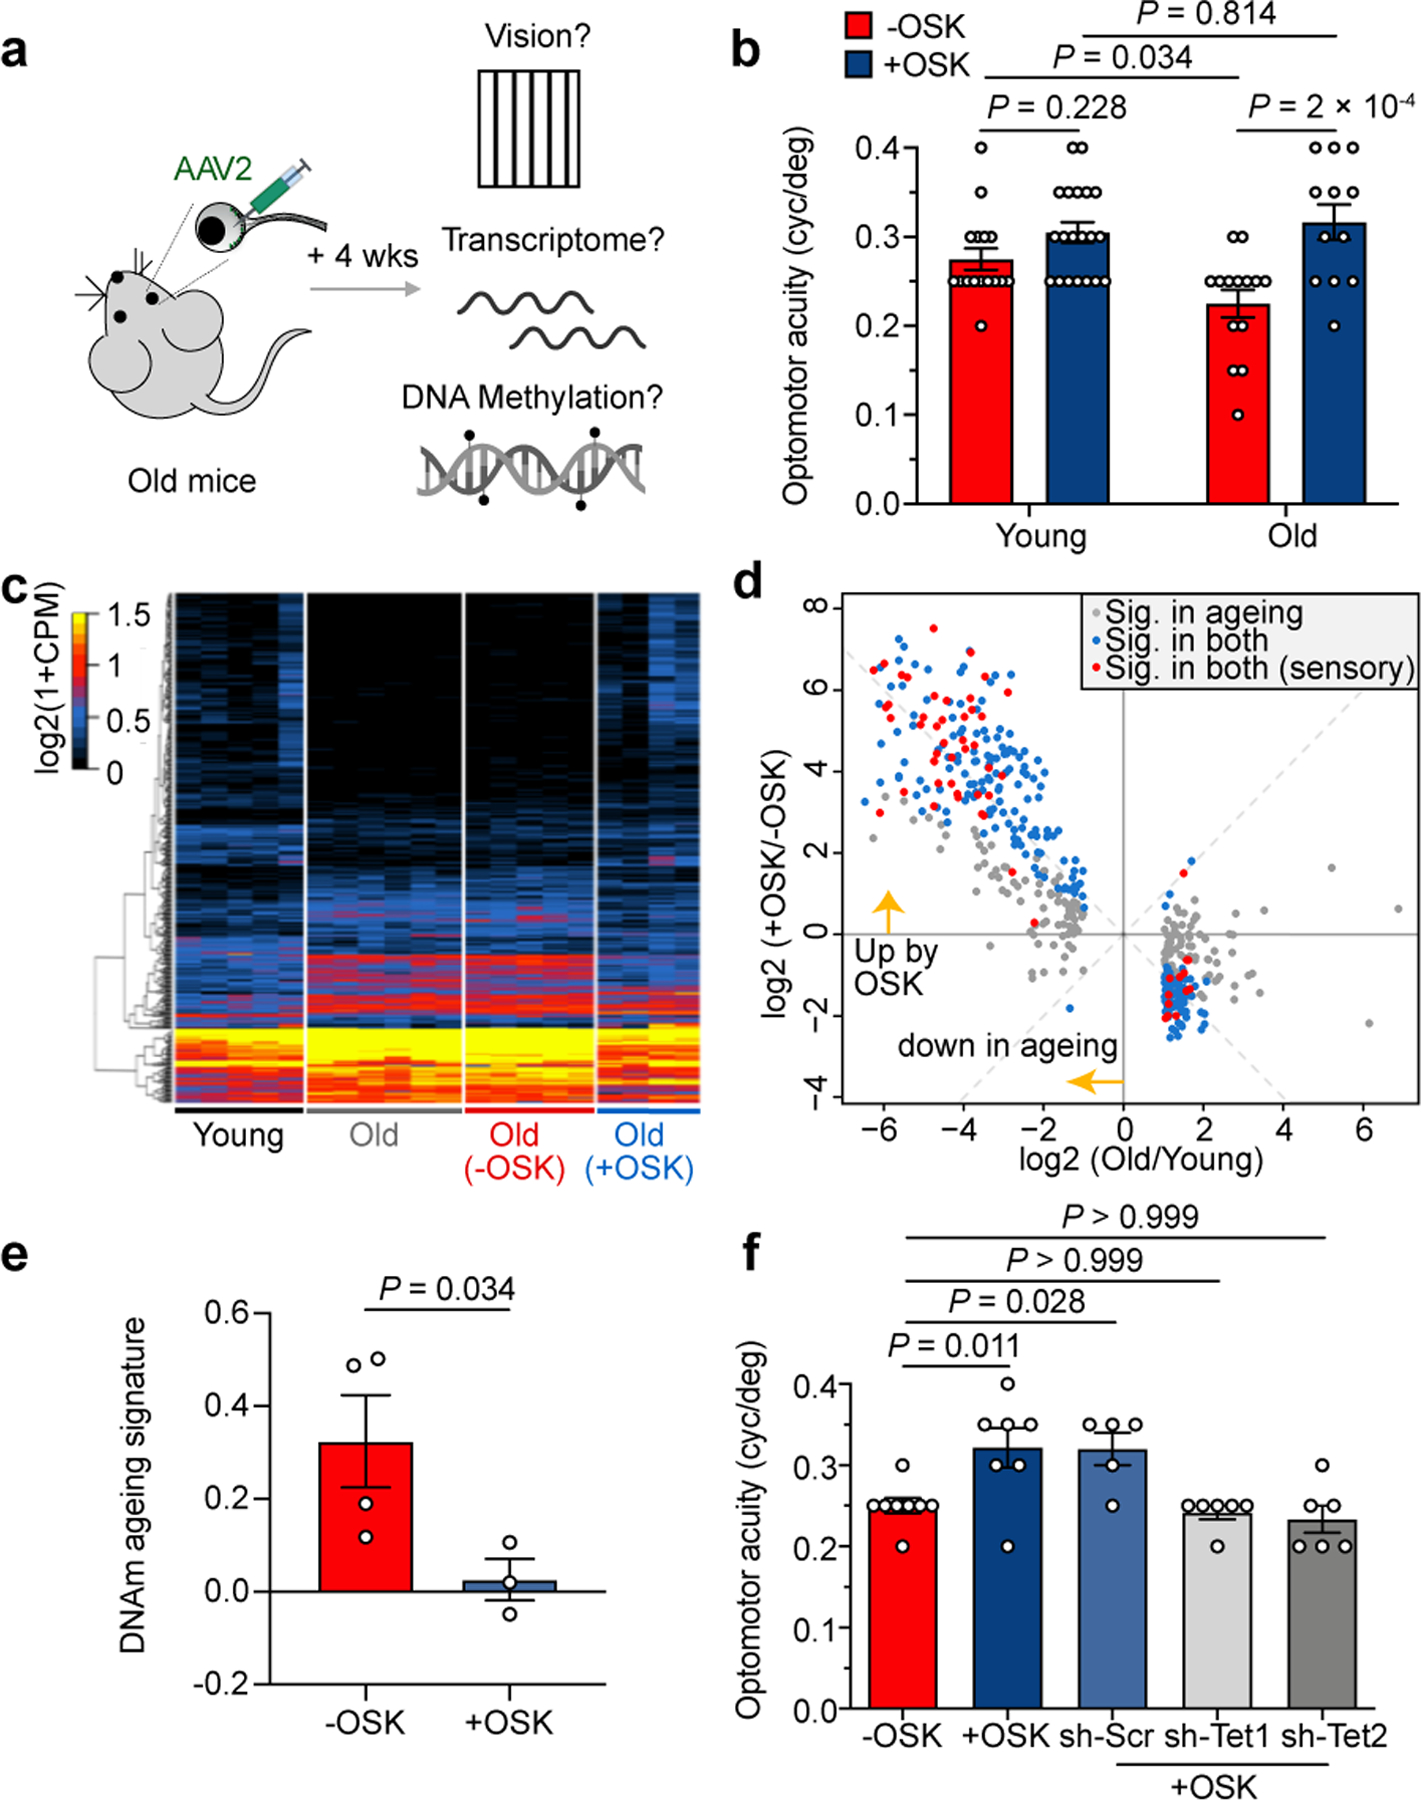
Restoration of youthful vision, transcriptome and DNAm ageing signature in old mice.
a, Experimental outline for testing the effect of reprogramming in old mice. b, Visual acuity in young (4 mo) and old mice (12 mo) after 4 weeks of −OSK or +OSK treatment (n = 16, 20, 14, and 12 eyes; similar results from 2 independent experiments combined). mo, month(s). c and d, Hierarchical clustered heatmap (c) and scatter plot (d) showing mRNA levels of 464 genes that were differentially expressed between young and old RGCs and the effect of OSK. RGCs were sorted from untreated young (5 mo, n = 5), old (12 mo, n = 6), or treated old retinas (−OSK, n = 5; +OSK, n = 4). Gene selection criteria for c and d are described in the methods. e, DNAm ageing signatures of 12-mo-old RGCs infected for 4 weeks with: −OSK, or +OSK (n = 4 and 3 retinas). f, Visual acuity in old mice (12 mo) treated for 4 weeks with: −OSK, +OSK, or +OSK together with sh-Scr, sh-Tet1, or sh-Tet2 (n = 8, 7, 5, 6, and 6 eyes). −OSK: AAV2-rtTA;TRE-OSK for b, AAV2-TRE-OSK for c and d, AAV2-tTA;TRE-d2EGFP for e; +OSK: AAV2-tTA;TRE-OSK for b–f. Two-way ANOVA with Bonferroni correction in b; Kruskal-Wallis test for e; one-way ANOVA with Bonferroni correction in f, with comparisons to the −OSK group. All bar graphs are presented as mean ± s.e.m.
Because there was no obvious increase in the number of RGC or axon density in the 12-month-old mice treated with +OSK AAV (Extended Data Fig. 9g, ,h),h), we hypothesized that the visual improvements were due to transcriptomic changes. RGCs from 12-month-old mice, either untreated or treated with OSK, were FACS-purified and analyzed by RNA-seq. Compared to RGCs from 5-month-old young mice, the mRNA levels of 464 genes were altered during ageing. Remarkably, ~90% of them were restored to youthful levels by OSK treatment (Fig. 4c, ,d,d, Extended Data Fig. 9i, Supplementary Table 2). Of the 268 age-downregulated genes, 44 are linked to sensory perception and axon targeting44, raising the possibility that they contribute to the decline in vision caused by ageing (Fig. 4d, Extended Data Fig. 9j and 10a). Another 196 genes that were up-regulated during ageing are involved in ion transport or neuronal projection development, including Efemp1 (Extended Data Fig. 10b–d), a Tet1- and Tet2-regulated gene associated with glaucoma45 and age-related macular degeneration (AMD)46.
To gain insights into how DNA methylation changes might be involved in the effects of OSK, we used machine learning to identify a methylation ageing signature based on 1,226 sites from genome-wide DNAm datasets, derived from the first principal component (PC1) in multi-age training samples (Supplementary Table 3, Extended Data Fig 10e). In an independent set of test samples, OSK reversed the DNAm ageing signature in the context of both injury and ageing (Fig. 4e and Extended Data Fig 10f). Interestingly, the signature CpG sites were associated with genes involved in synaptic and neuronal processes and enriched for the binding of polycomb repressive complex 2 (PRC2) and its histone methyltransferase product H3K27me3, both of which are known to recruit Tet enzymes47,48 (Extended Data Fig 10g–i). Knockdown of either Tet1 or Tet2 altered the methylation status of the signature CpG sites in a similar way and counteracted the effect of OSK on DNAm age (Extended Data Fig. 10j–l). Both Tet1 and Tet2 were also required to improve RGC function and vision in 12-month-old mice (Fig. 4f, Extended Data Fig. 10m), indicating that changes in DNA methylation may play a functional role in the restoration of vision in old mice by OSK.
Discussion
Here, we show that it is possible to safely reverse the age of a complex tissue and restore its biological function in vivo. Using the eye as a model system, we present evidence that ectopically expressed OSK safely induces in vivo epigenetic restoration of aged CNS neurons, without causing a loss of cell identity or pluripotency. Instead, OSK promotes a youthful epigenetic signature and gene expression pattern that causes the neurons to function as though they were young again. The requirement for active demethylation in this process supports the idea that changes in DNA methylation patterns are involved in the ageing process and its functional reversal (Extended Data Fig. 10n). That said, we do not wish to imply that DNA methylation is the only epigenetic mark involved in this process. It likely involves other transcription factors and epigenetic modifications, such as the PRC2 complex and H3K27me3, both of which are involved in maintaining stem cell plasticity and are associated with DNAm clock sites4,49,50.
Perhaps the most interesting question raised by these data is: How do cells encode and store youthful epigenetic information? Possibilities for information storage include covalent DNA modifications, DNA binding proteins, RNA-guided chromatin modifying factors, and RNA-DNA hybrids that are established early in life. The role of these youth marks would be akin to Shannon’s “Observer” in Information Theory, which preserves an original backup copy of information in case it is lost or obscured by noise11. We envision that epigenetic reprogramming, either by gene therapy or other means, could promote tissue repair and the reversal of age-related decline in humans.
Methods
Mouse lines
For optic nerve crush and glaucoma model experiments, C57BL6/J wild type mice were purchased from the Jackson Laboratory (000664). Young and old females from the NIA Aged Rodent Colonies were used for ageing experiments. Rosa26-M2rtTA/Col1a1-tetOP-OKS-mCherry alleles were from the Hochedlinger lab (Massachusetts General Hospital)51. Rosa-CAG-lox-STOP-lox-Tomato mice were provided by Fan Wang (McGovern Institute). Vglut2-IRES-Cre (016963), Vgat-IRES-Cre (016962), Tet2flox/flox (017573)52 and Rosa26-M2rtTA/Col1a1-tetOP-OSKM (011011) were purchased from the Jackson Laboratory. All animal work was approved by the Institutional Animal Care and Use Committees (IACUCs) at Harvard Medical School, Boston Children’s Hospital, and the Mass Eye and Ear Institution. Animals were housed under 12-hour light/dark cycles 6am-6pm-6am, 70–72°F ambient temperature, and 40–50% humidity.
Surgery
Mice were anesthetized by intraperitoneal injection of a mixture of ketamine (100 mg/kg; Ketaset; Fort Dodge Animal Health, Fort Dodge, IA) and xylazine (10 mg/kg; TranquiVed; Vedco, Inc., St. Joseph, MO) supplemented by topical application of proparacaine to the ocular surface (0.5%; Bausch & Lomb, Tampa, FL). All animal procedures were approved by the IACUC of the respective institutions and according to appropriate animal welfare regulations.
Production of adeno associated viruses (AAVs)
Vectors of AAV-TRE-OSK were made by cloning mouse Oct4, Sox2 and Klf4 cDNA into an AAV plasmid consisting of the Tetracycline Response Element (TRE3G promoter) and the SV40 element. The other homemade vectors were made using a similar strategy or directly chemically synthesized. All pAAVs, as listed (Supplementary Table 4), were then packaged into AAVs of serotype 2/2, 2/DJ or 2/9 (titers: > 5×10¹² genome copies/ml). AAVs were produced by the Boston Children’s Hospital Viral Core.
Systemic delivery of AAV9
Expression in internal organs was achieved through retro-orbital injection of AAV9: 7×10¹¹ gc of UBC-rtTA and 3×10¹¹ gc of TRE-OSK for 5-month-old mice; 7×10¹¹ gc of UBC-rtTA and 5×10¹¹ gc of TRE-OSK (or TRE-GFP) for 20-month-old mice. To induce OSK expression, doxycycline (1 mg/ml; MP Biochemicals) was given in drinking water continuously until the end of the experiment, 3 weeks post-AAV injection.
Cell culture of ear fibroblasts
Ear fibroblasts were isolated from Reprogramming 4F (Jackson Laboratory 011011) or 3F (Hochedlinger lab, Massachusetts General Hospital) mice and cultured at 37ºC in DMEM (Invitrogen) containing non-essential amino acids, 10% tetracycline-free fetal bovine serum (TaKaRa Bio, 631106) and 1% penicillin/streptomycin (ThermoFisher Scientific, 15140122). EFs of transgenic OSKM and OSK mice were passaged to P3 and treated with doxycycline (2 µg/ml) for the indicated time periods in the culture medium. All cell lines used were mycoplasma negative.
AAV2 intravitreal injection
Adult animals were anesthetized with ketamine/xylazine (100/10 mg/kg), and then AAV (1–2 µl) was injected intravitreally, just posterior to the limbus with a fine glass pipette attached to a Hamilton syringe using plastic tubing. In the elevated IOP model, mice received a 1 µl intravitreal injection between 3–4 weeks following microbead injection. The injected volume of AAV-sh-RNA is 1/5th the volume of other AAVs.
Optical Coherence Tomography (OCT)
OCT images were taken with a Bioptigen Envisu R-Class OCT (Leica Microsystems). The animals were anesthetized with a ketamine/xylazine (100–200/20 mg/kg) cocktail and eyes were treated with a drop of 1% tropicamide solution to dilate the pupils and a drop of GenTeal gel to keep the lens hydrated. Full retinal OCT scans were obtained for all eyes (1000× 100× 10). 100 B-scans were converted into 7 fps videos with ImageJ. Representative OCT images of the retina were taken near the optic nerve head, and the imaging location was marked on the volume intensity projection image with a white line. The retinal thickness in each eye was measured using 4 B-scans at a distance of 50 – 600 µm on both sides of the optic nerve head and averaged using ImageJ.
Creation of retinoblastoma tumors
In order to create the space to inject the retinoblastoma tumor cells into the subretinal space, a transient retinal detachment was created. Intraocular pressure was decreased by first making a corneal incision, followed by a subretinal injection of 10,000 retinoblastoma tumor cells (Rb116) via a 30-gauge needle in a total volume of 10 μl. Two weeks post-injection the mice were observed via OCT.
Optic nerve crush
Two weeks after intravitreal AAV injection, the optic nerve was accessed intraorbitally and crushed in anesthetized animals using a pair of Dumont #5 forceps (FST). Alexa-conjugated cholera toxin beta subunit (CTB-555, 1 mg/ml; 1–2 µl) injection was performed 2–3 days before euthanasia to trace regenerating RGC axons. More detailed surgical methods were described previously29.
In vivo doxycycline induction or suppression
Induction of the Tet-On or suppression of the Tet-Off AAV2 systems in the retina was performed by administration of doxycycline (2 mg/ml) (Sigma) in the drinking water. Induction of Tet-On AAV9 system systemically was performed by administration of doxycycline (1 mg/ml) (USP grade, MP Biomedicals 0219895505) in the drinking water.
Quantification of axon regeneration for the optic nerve crush model
The number of regenerating axons in the optic nerve was estimated by counting the number of CTB-labeled axons at different distances from the crush site as described previously29.
Wholemount optic nerve preparation
Optic nerves and the connecting chiasm were dehydrated in methanol for 5 min, then incubated overnight with Visikol® HISTO-1™. The next day, nerves were transferred to Visikol® HISTO-2™ and then incubated for 3 hrs. Finally, optic nerves and connecting chiasm were mounted with Visikol® HISTO-2™.
Immunofluorescence
Wholemount retinas were blocked with horse serum 4°C overnight then incubated at 4°C for 3 days with primary antibodies diluted in PBS, BSA (3%) Triton X-100 (0.5%). Then, tissues were incubated at 4°C overnight with appropriate Alexa Fluor-conjugated secondary antibodies (Alexa 405, 488, 567, 674; Invitrogen) diluted with the same blocking solution as the primary antibodies, generally used at 1:400 final dilution. Frozen sections were stained overnight with primary antibodies at 4°C and then secondary antibodies at room temperature for 2 hrs. Between changes of solutions, all wholemounts or slices were washed 3 × 5 min each time. Sections or wholemount retinas were mounted with Vectashield Antifade Mounting Medium. Antibodies used: Mouse anti-Oct4 (1:100, BD bioscience 611203), Rabbit anti-Sox2 (1:100, Cell signaling 14962), Goat anti-Klf4 (1:100, R&D system AF3158), Rabbit anti-phosphorylated S6 Ser235/236 (1:100, Cell Signaling 4857), Mouse anti-Brn3a (1:200, EMD Millipore MAB1585), Rabbit anti-Ki67(1:100, Abcam ab15580), Mouse anti-AP2 alpha (1:100, Developmental Studies Hybridoma Bank 3B5), Rabbit anti-pStat3 (Tyr705) (1:100, Cell signaling 9145S), Rat anti-HA (1:400, Roche 11867423001), Rabbit anti-5mC (1:100, Cell signaling 28692S), Rabbit anti-5hmC (1:100, Active Motif 39769), Rat anti-BrdU (1:200, Abcam ab6326), Rabbit anti-Olig2 (1:100, Novusbio NBP1–28667) and Chicken anti-GFP (1:10,000, Aves Labs GFP-1020), and Guinea pig anti-RBPMS (1:400, Raygene custom order A008712 to peptide GGKAEKENTPSEANLQEEEVRC). Note that successful staining for anti-5mC, anti-5hmC, anti-Ki67, and anti-BrdU requires pre-treatment of 2 N HCl for 30min at room temperature, followed by 3 washes of 0.1 M Sodium Borate pH 8.3 and PBST each before the serum blocking.
5-Bromo-2′-deoxyuridine (BrdU) labelling
Post crush injury, mice were injected intraperitoneally with BrdU (Sigma, B5002) at a dose of 100 mg/kg daily the week before sacrifice. Optic nerves and retinas were collected either 1 or 2 wpc. Optic nerve sections and retina wholemounts were then performed with the same procedure described for immunofluorescence (including HCl pre-treatment) to complete the staining.
Western blot
SDS-PAGE and Western blot analysis was performed according to standard procedures and detected with an ECL detection kit. Antibodies used: Rabbit anti-Sox2 (1:100, EMD Millipore, AB5603), Mouse anti-Klf4 (1:1,000, ReproCell, 09–0021), Rabbit anti-p-S6 (S240/244) (1:1,000, CST, 2215), Mouse anti-S6 (1:1,000, CST, 2317), Mouse anti-β-Tubulin (1:1,000, Sigma-Aldrich, 05–661), Mouse anti-β-Actin−Peroxidase antibody (1:20,000, Sigma-Aldrich, A3854).
RGC survival and phospho-S6 signal
RBPMS-positive cells in the ganglion layer were stained with an anti-RBPMS antibody (1:400, Raygene custom order A008712 to peptide GGKAEKENTPSEANLQEEEVRC), and a total of four 10× fields per retina, one in each quadrant, were enumerated. The average number of viable RGCs per field was determined. Phospho-S6 (1:100, Cell Signaling 4857) staining was performed under the same conditions and the percentages of phopsho-S6-positive RGCs were obtained by comparing the value to the number of viable RGCs in the same field.
Human neuron differentiation and regeneration assay
We chose to use differentiated human neurons that would maintain ageing signatures53. SH-SY5Y neuroblastoma cells were obtained from the American Tissue Culture Collection (ATCC, CRL-2266). Cells were confirmed as negative for mycoplasma, then cultured in a 1:1 mixture of EMEM (ATCC, 30–2003) and F12 medium (ThermoFisher Scientific, 11765054) supplemented with 10% FBS (Sigma, F0926) and 1% penicillin/streptomycin (ThermoFisher Scientific, 15140122). Cells were cultured at 37°C with 5% CO2 and 3% O2. Cells were passaged at ~80% confluency. SH-SY5Y cells were differentiated into neurons as previously described54 with modifications. Briefly, 1 day after plating, cell differentiation was induced for 3 days using EMEM/F12 medium (1:1) containing 2.5% FBS, 1× penicillin/streptomycin, and 10 µM all-trans retinoic acid (ATRA, Stemcell Technologies, 72264) (Differentiation Medium 1), followed by a 3 day incubation in EMEM/F12 (1:1) containing 1% FBS, 1 × penicillin/streptomycin, and 10 µM ATRA (Differentiation Medium 2). Cells were then split into 35 mm cell culture plates coated with poly-D-lysine (ThermoFisher Scientific, A3890401). A day after splitting, neurons were matured in serum-free neurobasal/B27 plus culture medium (ThermoFisher Scientific, A3653401) containing 1 × Glutamax (ThermoFisher Scientific, 35050061), 1 × penicillin/streptomycin, and 50 ng/ml BDNF (Alomone labs) (Differentiation Medium 3) for at least 5 days. Differentiated SH-SY5Y cells were transduced with AAV.DJ vectors at 106 genome copies/cell. Five days after transduction, vincristine (100 nM; Sigma, V8879) was added for 24 hrs to induce neurite degeneration. Neurons were then washed once with PBS and fresh Differentiation Medium 3 was added back to the plates. Neurite outgrowth was monitored for 2–3 weeks by taking phase-contrast images at 100x magnification every 3–4 days. Neurite area, axon number and length of each cluster of neurons were quantified using Image J.
Cell cycle analysis
Cells were harvested and fixed with 70% cold ethanol for 16 hrs at 4°C. After fixation, cells were washed twice with PBS and incubated with PBS containing 50 μg/mL propidium iodide (Biotium, 40017) and 100 μg/mL RNase A (Omega) for 1 hr at room temperature. PI-stained samples were analyzed on a BD LSR II analyzer and only single cells were gated for analysis. Cell cycle profiles were analyzed using FCS Express 6 (De Novo Software).
Human neuron DNA methylation analyses
DNA was extracted using the Zymo Quick DNA mini-prep plus kit (D4069) and DNA methylation levels were measured on Illumina 850 EPIC arrays. The Illumina BeadChip (EPIC) measured bisulfite-conversion-based, single-CpG resolution DNA methylation levels at different CpG sites in the human genome. Data were generated via the standard protocol of Illumina methylation assays ({“type”:”entrez-geo”,”attrs”:{“text”:”GSE147436″,”term_id”:”147436″}}GSE147436), which quantifies methylation levels by the β value using the ratio of intensities between methylated and unmethylated alleles. Specifically, the β value was calculated from the intensity of the methylated (M corresponding to signal A) and unmethylated (U corresponding to signal B) alleles, as the ratio of fluorescent signals β = Max(M,0)/(Max(M,0)+ Max(U,0)+100). Thus, β values ranged from 0 (completely unmethylated) to 1 (completely methylated). “Noob” normalization was implemented using the “minfi” R package55,56. The mathematical algorithm and available software underlying the skin & blood clock for in vitro studies (based on 391 CpGs) was previously published57.
Microbead-induced elevated intraocular pressure (IOP)
Elevation of IOP was induced unilaterally by injection of polystyrene microbeads (FluoSpheres; Invitrogen, Carlsbad, CA; 15-μm diameter) to the anterior chamber of the right eye of each animal under a surgical microscope, as previously reported40. Briefly, microbeads were prepared at a concentration of 5.0 × 10⁶ beads/mL in sterile physiologic saline. A 2 μL volume was injected into the anterior chamber through a trans-corneal incision using a sharp glass micropipette connected to a Hamilton syringe (World Precision Instruments Inc., Sarasota, FL) followed by an air bubble to prevent leakage. Any mice that developed signs of inflammation (clouding or an edematous cornea) were excluded.
IOP measurements
IOPs were measured with a rebound TonoLab tonometer (Colonial Medical Supply, Espoo, Finland), as previously described40. Mice were anesthetized by 3% isoflurane in 100% oxygen (induction) followed by 1.5% isoflurane in 100% oxygen (maintenance) delivered with a precision vaporizer. IOP measurement was initiated within 2–3 min after the loss of a toe or tail pinch reflex. Anesthetized mice were placed on a platform, and the tip of the pressure sensor was placed approximately 1/8 inch from the central cornea. Average IOP was displayed automatically after 6 measurements after elimination of the highest and lowest values. The machine-generated mean was considered as one reading, and six readings were obtained for each eye. All IOPs were taken at the same time of day (between 10:00 and 12:00 hrs) due to the variation of IOP throughout the day.
Optomotor response
Visual acuity of mice was measured using an optomotor reflex-based spatial frequency threshold test58. Mice were able to freely move and were placed on a pedestal located in the center of an area formed by four computer monitors arranged in a quadrangle. The monitors displayed a moving vertical black and white sinusoidal grating pattern. A blinded observer, unable to see the direction of the moving bars, monitored the tracking behavior of the mouse. Tracking was considered positive when there was a movement of the head (motor response) to the direction of the bars or rotation of the body in the direction concordant with the stimulus. Each eye was tested separately depending on the direction of rotation of the grating. The staircase method was used to determine the spatial frequency start from 0.15 to 0.40 cycles/deg, with intervals of 0.05 cycles/deg. Rotation speed (12°/s) and contrast (100%) were kept constant. Responses were measured before and after treatment by individuals blinded to the group of the animal and the treatment. Mice that had intravitreal bleeding or developed signs of inflammation (clouding or an edematous cornea) during or post intravitreal injection were excluded from OMR and histological analyses. Exclusion criteria were pre-determined before experimentation.
Pattern electroretinogram (PERG)
Mice were anesthetized with ketamine/xylazine (100mg/kg and 20mg/kg) and the pupils dilated with one drop of 1% tropicamide ophthalmic solution. The mice were kept under dim red light throughout the procedure on a built-in warming plate (Celeris, Full-Field and Pattern Stimulation for the rodent model) to maintain body temperature at 37°C. A black and white reversing checkerboard pattern with a check size of 1° was displayed on light guide electrode-stimulators placed directly on the ocular surface of both eyes and centered with the pupil. The visual stimuli were presented at 98% contrast and constant mean luminance of 50 cd/m2, spatial frequency: 0.05 cyc/deg; temporal frequency: 1Hz. A total of 300 complete contrast reversals of PERG were repeated twice in each eye and the 600 cycles were segmented, averaged, recorded. The averaged PERGs were analyzed to evaluate the peak to trough N1 to P1 (positive wave) amplitude.
Quantification of optic nerve axons in the glaucoma model
For quantification of axons, optic nerves were dissected and fixed overnight in Karnovsky’s reagent (50% in phosphate buffer). Semi-thin cross-sections of the nerve were taken at 1.0 mm posterior to the globe and stained with 1% p-phenylenediamine (PPD) for evaluation by light microscopy. Optic nerve cross sections were imaged at 60x magnification using a Nikon microscope (Eclipse E800, Nikon, Japan) with the DP Controller v. 1.2.1.108 and the DP Manager v. 1.2.1.107 software (Olympus). 6–8 non-overlapping photomicrographs were taken to cover the entire area of each optic nerve cross-section. Using ImageJ (Version 2.0.0-rc-65/1.51u), a 100 μM × 100 μM square was placed on each 60x image and all axons within the square (0.01 mm2) were counted using the “threshold” and “analyze particles” functions in ImageJ as previously described40,58,59. Damaged axons stain darkly with PPD and were not counted. The average axon counts in the 6–8 images were used to calculate the axon density/mm2 of optic nerve. Individuals performing axon counts were blinded to the experimental groups.
Quantification of retinal ganglion cells in the glaucoma model
For ganglion cell counting, images of wholemount retinas were acquired using a 63x oil immersion objective of the Leica TCS SP5 confocal microscope (Leica Microsystems). The retinal wholemount was divided into four quadrants and two to four images (248.53 μm by 248.53 μm in size) were taken from the midperipheral and peripheral regions of each quadrant, for a total of twelve to sixteen images per retina. The images were obtained as z-stacks (0.5 μm), and all Brn3a positive cells in the ganglion cell layer of each image were counted using an automated counting platform as previously described59,60. Briefly, RGCs were counted using the “Cell Counter” plugin (http://fiji.sc/Cell_Counter) in Fiji (ImageJ Fiji, version 2.0.0-rc-69/1.52n). Each image was loaded into Fiji, and a color counter type was chosen to mark all Brn3a stained RGCs within each image (0.025 mm2). The average number of RGCs in the 12–16 images were used to calculate the RGC density per square millimeter of retina. Two individuals blinded to the experimental groups performed all RGC counts.
RGC enrichment
Retinas were dissected in AMES solution (oxygenated with 95% O2/5% CO2), digested in papain, and dissociated to single cell suspensions with manual trituration in ovomucoid solution. Cells were spun down at 450 × g for eight minutes, resuspended in AMES+4%BSA to a concentration of 105 cells/ml. Thy1.2-PE-Cy7 antibody (1:2000, Invitrogen 25–0902-81) was added incubated for 15 min, followed by washing with an excess of media. Cells were spun down at 450 × g for eight minutes and resuspended again in AMES+4%BSA at a concentration of ~7 × 10⁶ cells/ml. The live cell marker Calcein Blue (1µl/ml) was added before filtering cells through 35µm cell strainer into FACS tubes. Over 10,000 high Thy1.2+ and Calcein Blue+ cells were collected using a BD FACS Aria Cell Sorter with an 130µm nozzle. Frozen cells were sent to GENEWIZ, LLC (South Plainfield, NJ, USA) for RNA extraction and ultra-low input RNA-seq, or to Zymo Research (Irving, CA) for DNA extraction and genome-wide reduced representation bisulfite sequencing (RRBS).
RRBS library preparation
RGC DNA from mice at different ages and treatments (Supplementary Table 5) was extracted using Quick-DNA Plus Kit Microprep Kit. 2–10 ng of starting input genomic DNA was digested with 30 units of MspI (NEB). Fragments were ligated to pre-annealed adapters containing 5’-methyl-cytosine instead of cytosine according to Illumina’s specified guidelines. Adaptor-ligated fragments ≥ 50 bp in size were recovered using the DNA Clean & Concentrator™-5 (Cat#: D4003). The fragments were then bisulfite-treated using the EZ DNA Methylation-Lightning™ Kit (Cat#: D5030). Preparative-scale PCR products were purified with DNA Clean & Concentrator™-5 (Cat#: D4003) for sequencing on an Illumina HiSeq using 2×125 bp paired end (PE).
DNA methylation analysis of mouse RGC
Reads were filtered using trim galore v0.4.1 and mapped to the mouse genome GRCm38 using Bismark v0.15.0. Methylation counts on both positions of each CpG site were combined. Only CpG sites covered in all samples were considered for analysis (BioProject PRJNA655981). Two outliers were excluded by low intercorrelation (< 0.93) within the batch (Supplementary Table 5). This resulted in a total of 703,583 sites, covered by uniquely mapped reads. Differential methylation for each CpG site was calculated using two-tailed Student’s t-tests on every site independently, followed by Benjamini-Hochberg procedure to adjust for false discovery rate. Delta between groups was calculated as difference between the means of values in two corresponding groups of samples. Gene ontology analysis of differentially methylated sites was performed with Cistrome-GO (http://go.cistrome.org). Due to the repetitive nature of ribosomal DNA sequence, it is not suitable to whole-genome bisulfite mapping. Thus, to determine the ribosomal DNAm age, reads were mapped to ribosomal DNA repeat {“type”:”entrez-nucleotide”,”attrs”:{“text”:”BK000964″,”term_id”:”511668571″,”term_text”:”BK000964″}}BK000964 and the coordinates were adjusted accordingly33. 67/72 sites with at least 10 reads per site were covered for the ribosomal DNAm clock, compared to 102/435 sites of the whole lifespan multi-tissue clock61, or 248/582 and 77,342/ 193,651 sites (ridge) of two entire lifespan multi-tissue clocks62. In agreement with previous studies57,63,64, DNAm age estimates of neurons tend to be lower than their chronological age but remain correlated.
DNAm ageing signature
Sorted RGC samples were split into training and test sets, with n=38 samples used for candidate CpG selection and biomarker construction and n=23 samples used for validation (Supplementary Table 6, Supplementary Data and Supplementary Code). The training samples included those from 1-month-old controls (1 mo; n=6), 6 mo (n=8), 12 mo (n=2), 18 mo (n=8), 30 mo (n=6), 1 mo GFP-injured (n=4), 12 mo GFP (n=2), and 12 mo OSK (n=2). To generate a methylation ageing signature, we evaluated DNAm associations with three traits: age, injury, and OSK treatment. To avoid batch effects, subsamples were evaluated separately as 6 mo and 18 mo in Batch 1, and 1 mo, 12 mo, and 30 mo in Batch 2 (Supplementary Table 5). Biweight midcorrelation was used to assess age trends for CpGs. Given that the second batch included samples from developing animals (1-month-old mice) we applied a transformation to age that has been used in development of human epigenetic clocks when prenatal and/or developmental samples are included4. This transformation accounts for non-linear changes during development. Biweight midcorrelation was then applied to test the associations of CpGs changes after injury and OSK treatment, and results were compared across the four tests. CpGs were selected if they were consistently in the top 30% of CpGs with the strongest absolute biweight midcorrelations in all four tests and showed consistency in the directionality of their associations (e.g. hypomethylated with age in both batches, hypomethylated with injury, and hypermethylated after OSK). Of the 703,583 CpGs that were considered, 1,226 were selected (723 that trended towards hypermethylation with age and 503 that trended towards hypomethylation with age, see Supplementary Table 3). Principal Component Analysis (PCA) was conducted using the training samples from 1 mo, 12 mo, and 30 mo controls (n = 14). PC1 explained 25% of the variance in this sample. When applying an elastic net model to train a predictor of age, PCs beyond PC1 did not increase the robustness of the age prediction65. Thus, PC1 was used to represent the ageing signature and was standardized to have a mean = 0 and s.d. = 1. Analyses of the ageing signature in independent validation samples were then conducted to test associations with age, injury, and OSK.
Transcription factor (TF) binding and histone modification enrichment
To identify factors that may mediate epigenetic reprogramming in RGCs, we performed TF binding enrichment and histone modification enrichment analyses using the genome coordinates (GRCm38/mm10) of the 1,226 selected CpGs using the CistromeDB Toolkit (http://dbtoolkit.cistrome.org). A sensitivity analysis was conducted by performing TF and histone enrichment for five sets of 1,226 random CpGs from the 702,357 unselected sites, which was then compared against the enrichment for our selected set in in order to identify TFs and histone marks that were specific to the selected set but not CpGs in general.
Total RNA extraction and sample quality control
Total RNA was extracted following the Trizol Reagent User Guide (Thermo Fisher Scientific). 1 µl of 10 mg/ml glycogen was added to the supernatant to increase RNA recovery. RNA was quantified using a Qubit 2.0 Fluorometer (Life Technologies, Carlsbad, CA, USA), and RNA integrity was determined using TapeStation (Agilent Technologies, Palo Alto, CA, USA).
Ultra-low input RNA library preparation and multiplexing
RNA samples were quantified using a Qubit 2.0 Fluorometer (Life Technologies, Carlsbad, CA, USA), and RNA integrity was ascertained using a 2100 TapeStation (Agilent Technologies, Palo Alto, CA, USA). RNA library preparations, sequencing reactions, and initial bioinformatics analysis were conducted at Genewiz (South Plainfield, NJ, USA). A SMART-Seq v4 Ultra Low Input Kit for Sequencing was used for full-length cDNA synthesis and amplification (Clontech, Mountain View, CA), and Illumina Nextera XT library was used for sequencing library preparation. Briefly, cDNA was fragmented, and adaptors were added using Transposase, followed by limited-cycle PCR to enrich and add an index to the cDNA fragments. The final library was assessed by a Qubit 2.0 Fluorometer and an Agilent TapeStation.
Paired End Sequencing
The sequencing libraries were multiplexed and clustered on two lanes of a flowcell. After clustering, the flowcell were loaded on the Illumina HiSeq instrument according to manufacturer’s instructions. Samples were sequenced using a 2×150 Paired End (PE) configuration. Image analysis and base calling were conducted by the HiSeq Control Software (HCS) on the HiSeq instrument. Raw sequence data (.bcl files) generated from an Illumina HiSeq was converted into fastq files and de-multiplexed using the Illumina bcl2fastq v2.17 program. One mismatch was allowed for index sequence identification.
RNA-seq analysis
Paired-end reads were aligned with hisat2 v2.1.066 to the Ensembl GRCm38 primary assembly using splice junctions from the Ensembl release 84 annotation. Paired read counts were quantified using featureCounts v1.6.467 using reads with a mapping quality (mapQ) value ≥ 20. Differentially-expressed genes for each pairwise comparison were identified with edgeR v3.2668, testing only genes with at least 0.1 counts-per-million (CPM) in at least three samples. Gene ontology analysis of differentially expressed genes (BioProject PRJNA655981) was performed with AmiGO v2.5.1269–71. Gene selection criteria for Fig. 4c, ,4d4d and and9i:9i: genes significantly changed during ageing (q < 0.05, absolute log2 fold-change > 1), not low expressed (log2(CPM) > – 2) or altered by mock AAV infection (Old vs Old (−OSK), q > 0.1).
Statistical analysis and figure preparation
Statistical analyses were performed with GraphPad Prism 7/8, using two-tailed Student’s t-tests, one-way or two-way ANOVA. All of the statistical tests performed are indicated in the figure legends. The data are presented as mean ± S.E.M., except for the violin plots in Extended Data Fig. 8e, ,f,f, which show median and quartiles. Statistical analysis of changes to DNA methylations was performed with SciPy package in python. Figures were prepared using Keynote and Affinity Designer.
Extended Data
Extended Data Fig. 1
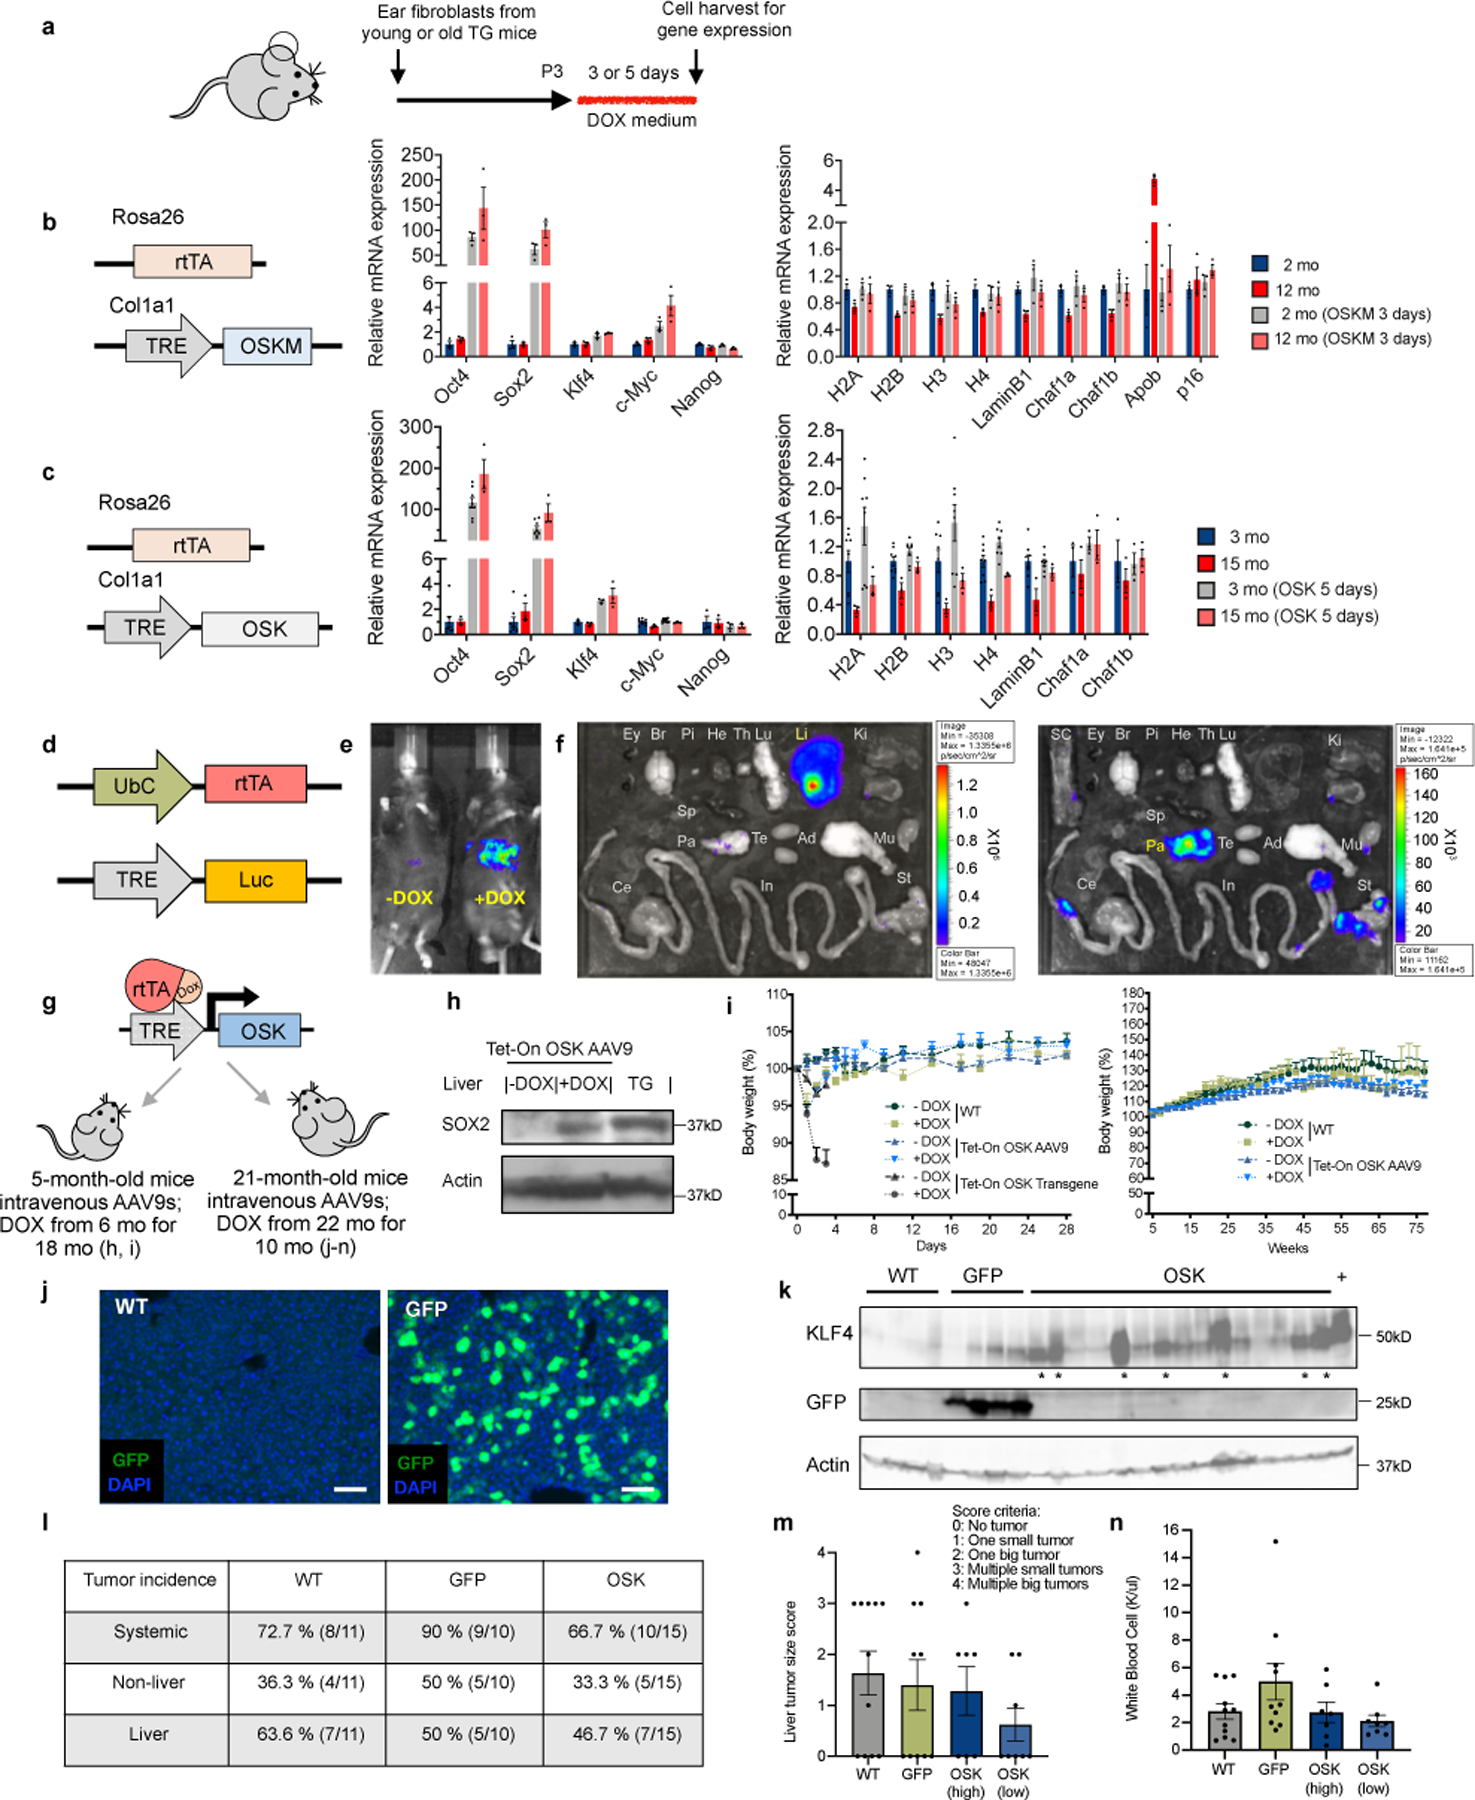
Effectiveness and safety of OSK reprogramming.
a, Experimental outline for testing the effects of OSKM and OSK on gene expression in fibroblasts from young and old transgenic (TG) mice. b and c, Expression of OSKM (b, R26rtTA; Col1a1OSKM, n = 3 biological replicates each condition) and OSK (c, R26rtTA; Col1a1OKS-mCherry, n = 3 and 8 biological replicates) rescue age-associated transcriptional changes without inducing Nanog mRNA. mo, month(s). qPCR primers are in Supplementary Table 7. d, AAV-ubiquitinC (UbC)-rtTA and AAV-TRE-Luc vectors for measuring tissue distribution. e, Luciferase imaging of WT mice 2 mo after intravenous injection (retro-orbital) of AAV9-UbC-rtTA;TRE-Luc (1.0 × 10¹² gene copies total). Doxycycline (Dox) was delivered in drinking water (1 mg/mL) for 7 days to +Dox mice. f, Luciferase imaging of the eye (Ey), brain (Br), pituitary gland (Pi), heart (He), thymus (Th), lung (Lu), liver (Li), kidney (Ki), spleen (Sp), pancreas (Pa), testis (Te), adipose (Ad), muscle (Mu), spinal cord (SC), stomach (St), small intestine (In), and cecum (Ce) 2 mo after retro-orbital injection of AAV9-UbC-rtTA;TRE-Luc followed by treatment with Dox for 7 days. The luciferase signal was primarily in the liver. Imaging the same tissues with a longer exposure time (right panel) with the liver removed, revealing a strong signal in the pancreas. g, Toxicity and safety studies in young and old mice after in vivo delivery of OSK-expressing AAVs. For h and i, at age 5 mo, mice were intravenously injected with AAV9-rtTA;TRE-OSK (3 and 7 × 10¹¹ gene copies each AAV/mouse). After 1 mo, mice remained untreated (−Dox) or treated with Dox (+Dox) for 18 mo. WT mice were not injected with AAV. For j–n, at age 21 mo, mice were injected intravenously with 5 × 10¹¹ gene copies of AAV9-rtTA and 7 × 10¹¹ of either AAV9-TRE-GFP (GFP) or TRE-OSK (OSK) per mouse. After 1 mo, GFP, OSK, and non-injected WT mice were treated with Dox for 10 mo. h, Sox2 expression in the liver of WT mice 2 mo post-intravenous delivery of OSK-expressing AAV9s with or without a mo of Dox induction, and in the liver of OSK transgenic (TG) mice, 129S1/C57BL/6J mixed background. Uncropped scans are shown in Supplementary Figure 1. i, Body weight of WT mice, OSK transgenic mice, and AAV-mediated OSK-expressing mice with or without doxycycline in the first 4 weeks (left panel, n = 5, 3, 6, 4, 4, and 3 mice) and following 17 mo (right panel, n = 5, 3, 6, and 4 mice). j, Examples of liver sections from WT or GFP mice showing the infection of AAV9. Scale bar, 100 µm. k, Klf4 and GFP protein levels in livers of WT, GFP, and OSK mice at 32 mo of age. * indicates high OSK expression, + indicates induced protein expression levels in livers of OSK transgenic mice. Uncropped scans in Supplementary Figure 1. l, Tumor incidence in WT, GFP, and OSK mice at age 32 mo after 10 mo of Dox induction. m and n, Liver tumor scores (m) and white blood cell counts (n) for WT, GFP, and OSK groups at age 32 mo after 10 mo of Dox induction. OSK mice were defined as either high expression (indicated by * in panel k) or low expression (WT, n = 11 mice; GFP, n = 10 mice; OSK high, n = 7 mice; OSK low, n = 8 mice). For m and n, there was no difference between the groups using one-way ANOVA. All data are presented as mean ± s.e.m.
Extended Data Fig. 2
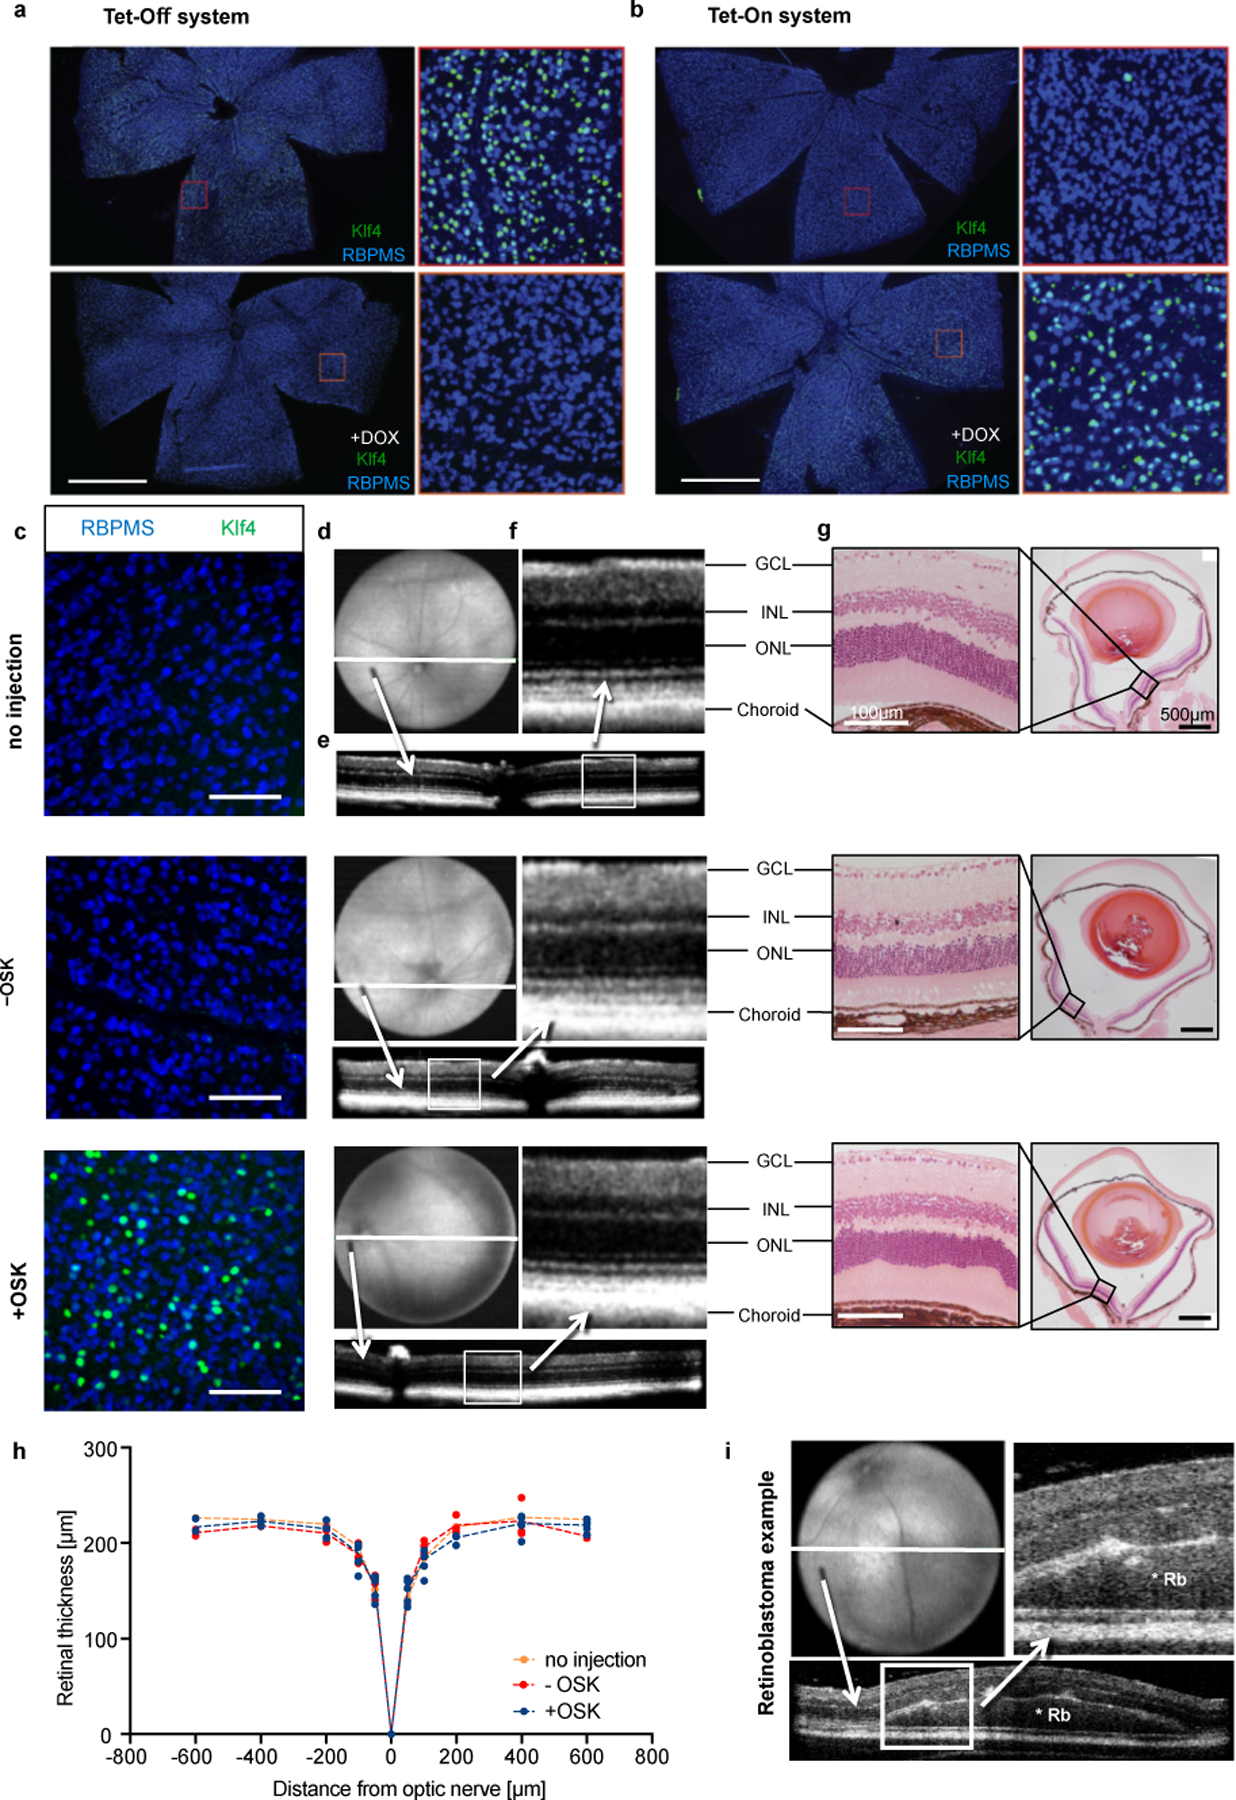
Normal architecture and absence of tumors in the retina after long-term OSK expression mediated by AAV2 delivery.
a and b, Representative wholemount retina display of RBPMS (a RGC marker) and Klf4 immunofluorescence showing (a) expression from the AAV2 Tet-Off system can be turned off by doxycycline in drinking water (2 mg/mL, 3 d), and (b) expression from the AAV2 Tet-On system can be turned on by doxycycline (2 mg/mL, 2 d). Scale bars in a and b, 1 mm. n = 4 retinas each condition. c, Corresponding retinal wholemount images stained for RBPMS and Klf4 are shown for each group tested (i) no injection, n = 6; (ii) −OSK (intravitreal injection of AAV2-rtTA;TRE-OSK without Dox induction), 10 mo post-injection, n = 3; (iii) +OSK (intravitreal injection of AAV2-tTA;TRE-OSK with Dox induction), 15 mo post-injection, n = 6. All retinas are from 16-month-old animals, showing similar expression within the group. Scale bar, 100 µm. d, Volume intensity projection of en-face OCT (optical coherence tomography) retinal image with a white line indicating the location of e. e, Representative retinal cross section B-scan images. White box indicates the location of the high magnification scans in f (retinal layers: GCL = ganglion cell layer, INL = inner nuclear layer, ONL = outer nuclear layer, and choroid). Videos of complete retinal cross section B-scan images of the entire globe are in Supplementary Videos. g, Low- and high-power representative images of H&E-stained cross-sections of corresponding eyes, verifying retinal layers. h, Quantitative measurements of retinal thickness, there was no difference between the groups at any location using two-way ANOVA with Bonferroni correction (n = 6, 3, and 6, respectively). i, Immunosuppressed NOD scid gamma mice received a subretinal injection of ~10,000 human retinoblastoma tumor cells. The OCT image shows a small retinal tumor and increased retinal thickness 14 days post-injection, demonstrating the ability of the OCT scan to detect tumors, * Rb (retinoblastoma).
Extended Data Fig. 3
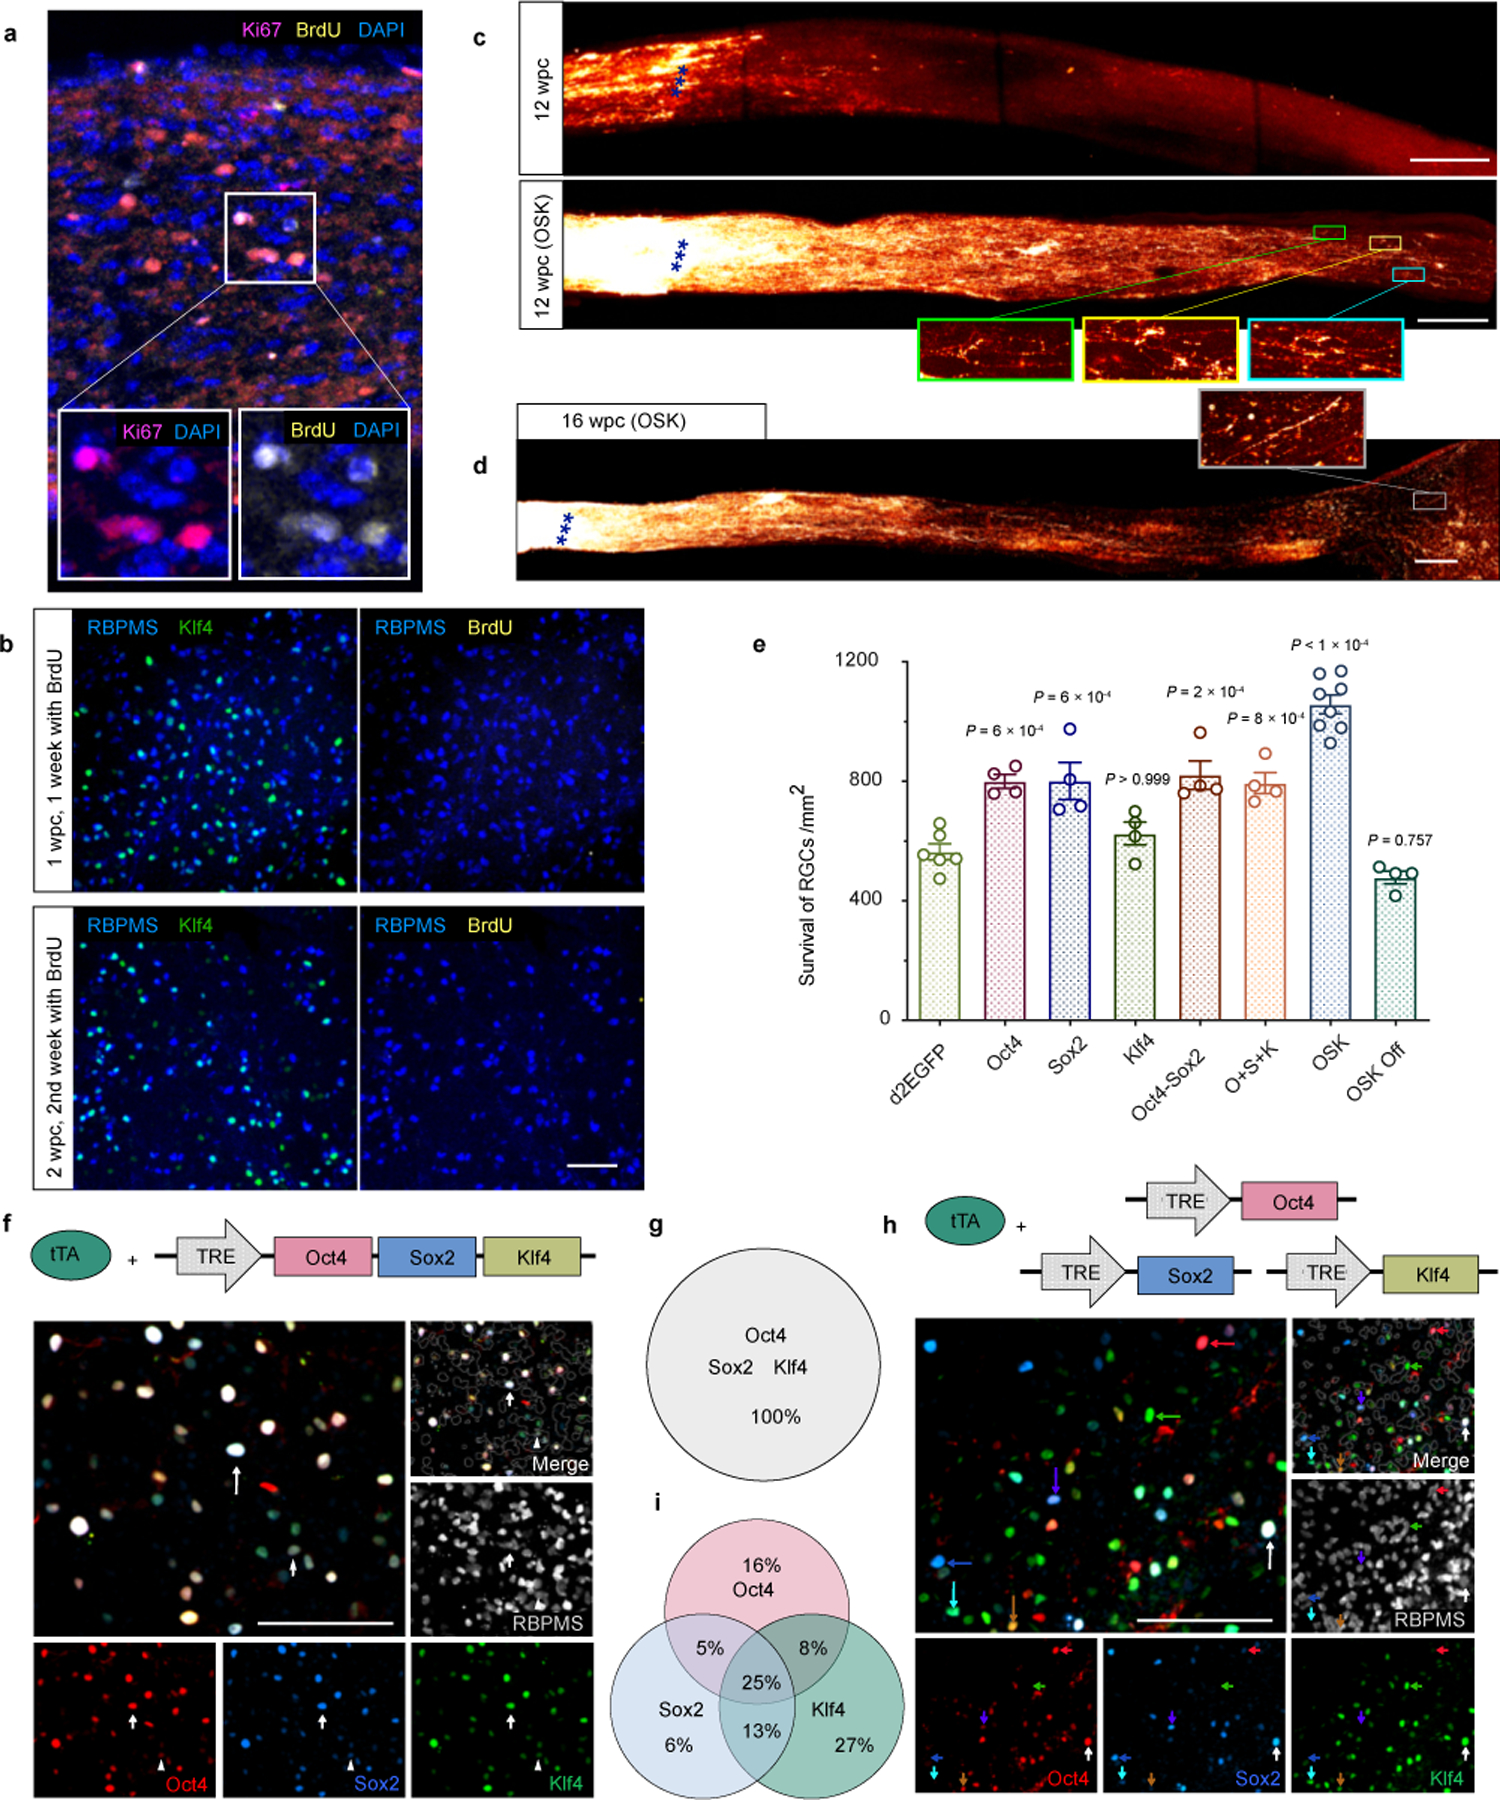
Polycistronic OSK induces long-distance axon regeneration post-injury without RGC proliferation.
a, Proliferating cells in the optic nerve (e.g. glial cells) in BrdU-injected mice as a positive control (n = 2 nerves). BrdU staining co-localized with Ki67, a proliferation marker. b, Representative Retina wholemount staining shows OSK-expressing RGCs do not stain for BrdU the first or second week after crush injury, n = 4 retinas. Scale bars, 100 µm. c, Imaging of optic nerves showing regenerating and sprouting axons with or without OSK AAV treatment, 12 weeks post-crush (wpc), n = 2 nerves. Scale bars, 200 µm. d, Whole nerve imaging showing CTB- labeled regenerative axons at 16 wpc in wild-type mice with intravitreal injection of AAV2-tTA;TRE-OSK (n = 2 nerves). Scale bars, 200 µm. e, Survival of RBPMS-positive cells in the RGC layer transduced with different AAV2s, 16 dpc (n = 6, 4, 4, 4, 4, 4, 8, and 4 eyes). All data are presented as mean ± s.e.m. f and g, Representative immunofluorescence (f) and sub-population proportion (g) of wholemount retinas transduced with a polycistronic AAV vector expressing Oct4, Sox2, and Klf4 in the same cell. White arrows designate triple-positive cells. n = 3 retinas. Scale bars, 100 µm. h and i, Immunofluorescence (h) and sub-population proportion (i) of wholemount retinas transduced with AAVs separately encoding Oct4, Sox2, and Klf4. Red, blue, and green arrows designate single-positive cells, with a white arrow marking a triple-positive cell, and other arrows marking double-positive cells. n = 3 retinas. Scale bar, 100 µm. One-way ANOVA with Bonferroni correction in e, with comparisons to d2EGFP shown.
Extended Data Fig. 4
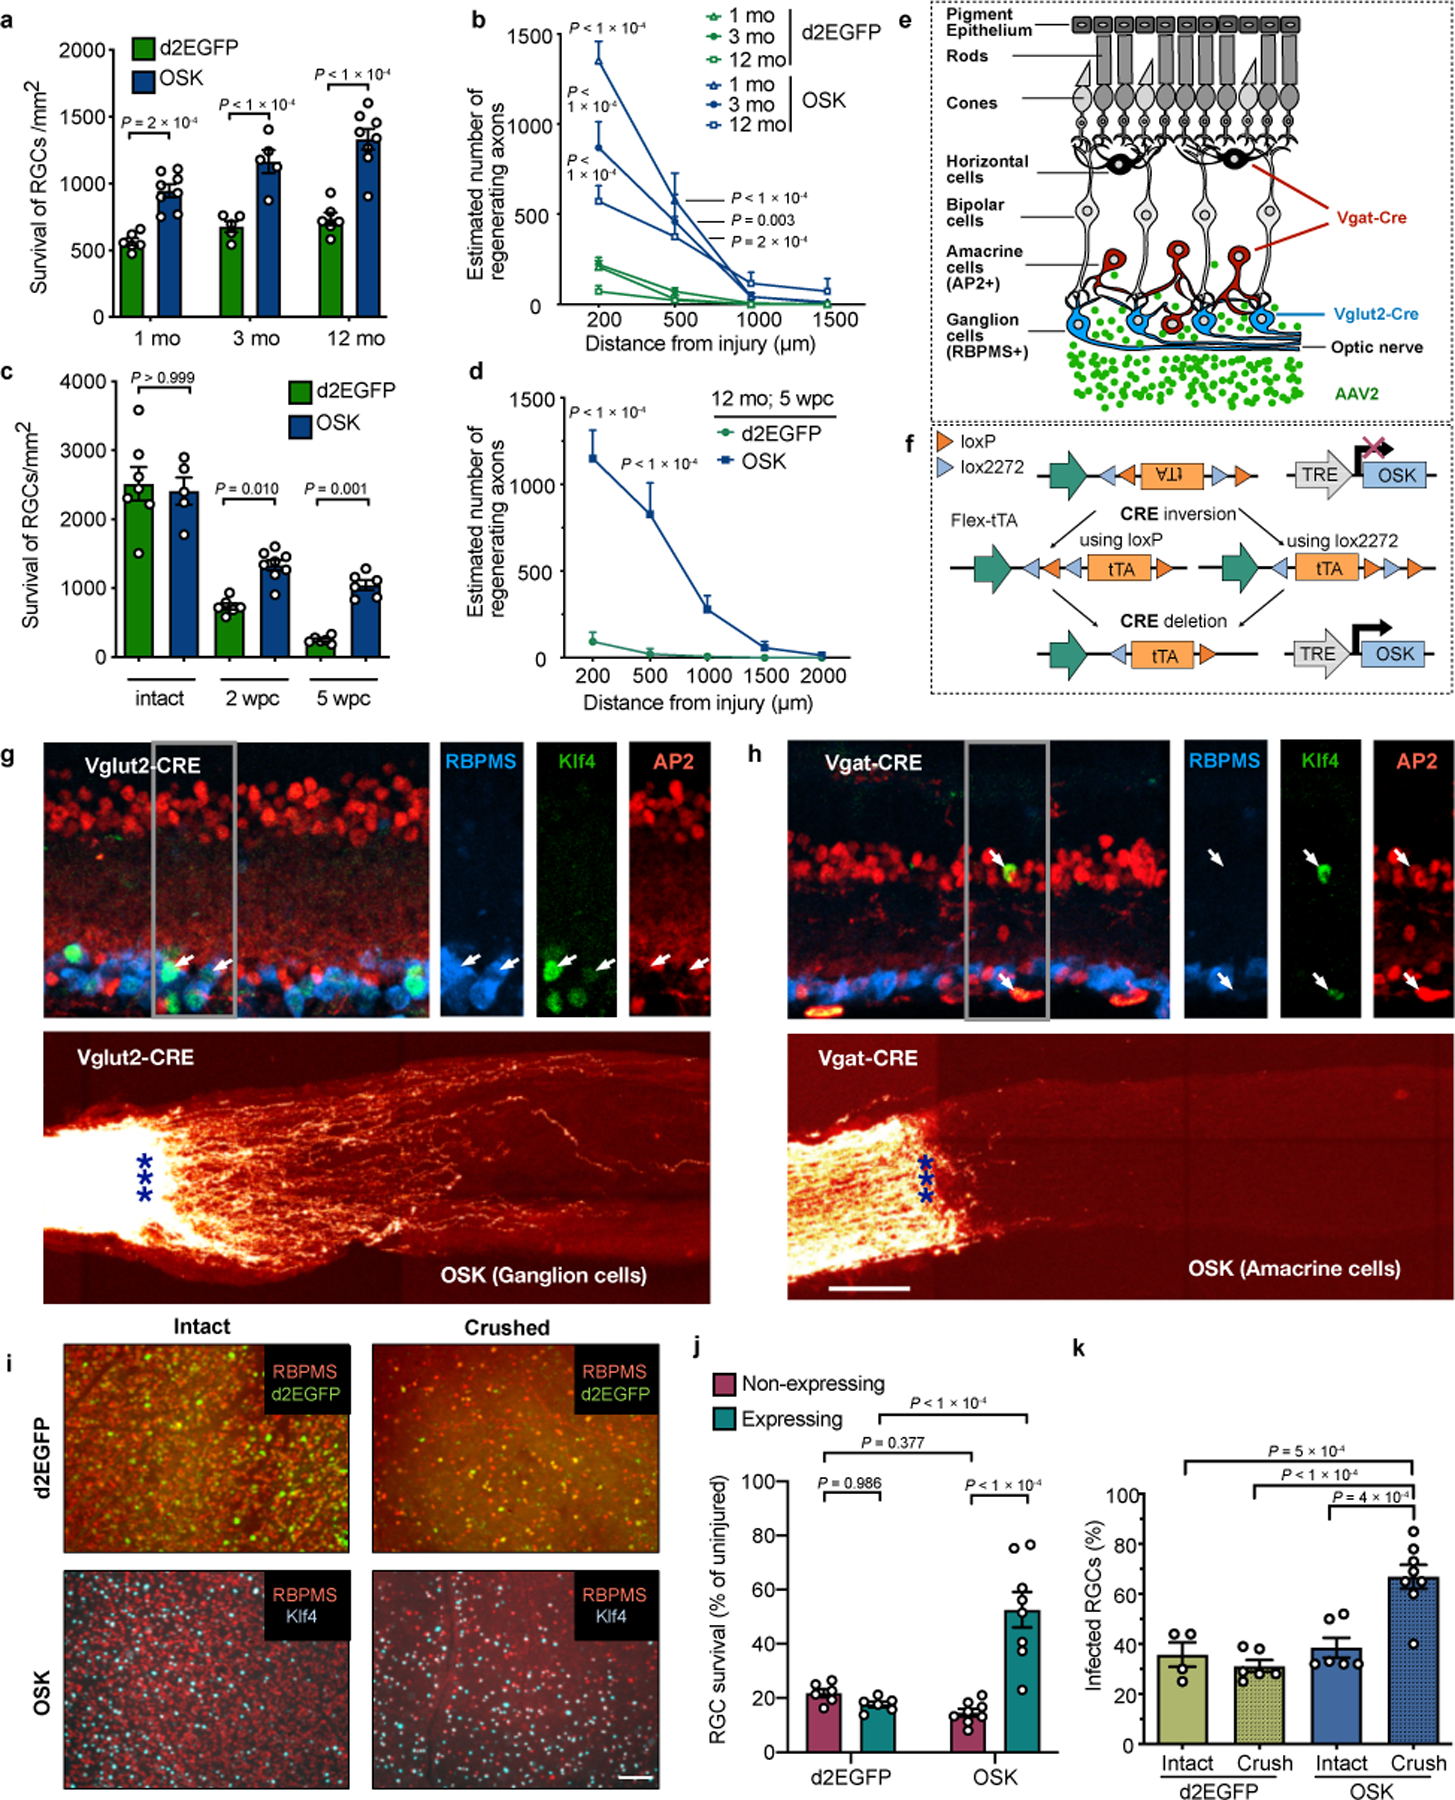
Regenerative and pro-survival effects of OSK are RGC-specific and cell-autonomous.
a, Effect of OSK expression on RGC survival in young (1 mo, n = 8), adult (3 mo, n = 5), and old mice (12 mo, n = 8) after optic nerve crush injury compared to expression of d2EGFP as a negative control (n = 6, 5, and 6, respectively). b, Axon regeneration after OSK expression compared to d2EGFP controls in young (1 mo, n = 5 and 6), adult (3 mo, n = 6), and old (12 mo, n = 4 and 5) mice, 2 wpc. c, RGC number of 12-month-old mice in intact, 2 or 5 wpc retinas with GFP (AAV2-tTA;TRE-d2EGFP, n = 7, 6, and 6, respectively) or OSK (AAV2-tTA;TRE-OSK, n = 5, 8, and 6, respectively) expression. d, Axon regeneration in 12-month-old mice with OSK AAV or control AAV (d2EGFP) treatment, 5 wpc (n = 5 nerves). e, Schematic of retinal structure showing Vglut2-Cre mice selectively expressing Cre in excitatory neurons such as RGCs, while Vgat-Cre mice selectively express Cre in inhibitory amacrine and horizontal cells. f, Schematic of the FLEx (flip-excision) CRE-switch system. AAV2-FLEx-tTA is inverted by Cre to express tTA and therefore induces OSK only in Cre-positive cells. g, Confocal image stack demonstrating delivery of AAV2-FLEx-tTA;TRE-OSK to intact Vglut2-Cre transgenic retinas, resulting in RGC-specific OSK expression (upper) and robust axon regeneration in the optic nerve (lower). White arrows indicate RBPMS+ (AP2-)-labeled RGCs that express Klf4 (green). n = 4 independent replicates. h, Confocal image stack demonstrating delivery of AAV2-FLEx-tTA;TRE-OSK to intact Vgat-Cre transgenic retinas, resulting in amacrine-specific OSK expression (upper) and poor axon regeneration in the optic nerve (lower). White arrows indicate AP2+ (RBPMS-)-labeled amacrine cells that express Klf4 (green). n = 4 independent replicates. i, Representative image of AAV-expressing or non-expressing RGCs in intact and crushed retinas 2 wpc with AAVs expressing d2EGFP or OSK. d2EGFP: AAV2-tTA;TRE-d2EGFP, n = 6 retinas; OSK: AAV2-tTA;TRE-OSK, n = 8 retinas. j, RGC survival rate (crushed / intact) of d2EGFP- (n = 6 eyes) or Klf4-expressing cells (n = 8 eyes) and their surrounding non-expressing cells indicating a cell-autonomous pro-survival effect of OSK-expressing RGCs after crush, 2 wpc. k, Frequency of d2EGFP- or Klf4-positive RGCs pre- or 2 weeks post-injury (n = 4, 6, 6, and 8 eyes). Two-way ANOVA with Bonferroni correction in a–d, j; one-way ANOVA with Bonferroni correction in k. Scale bars, 100 µm in g, h, and i. All data are presented as mean ± s.e.m.
Extended Data Fig. 5
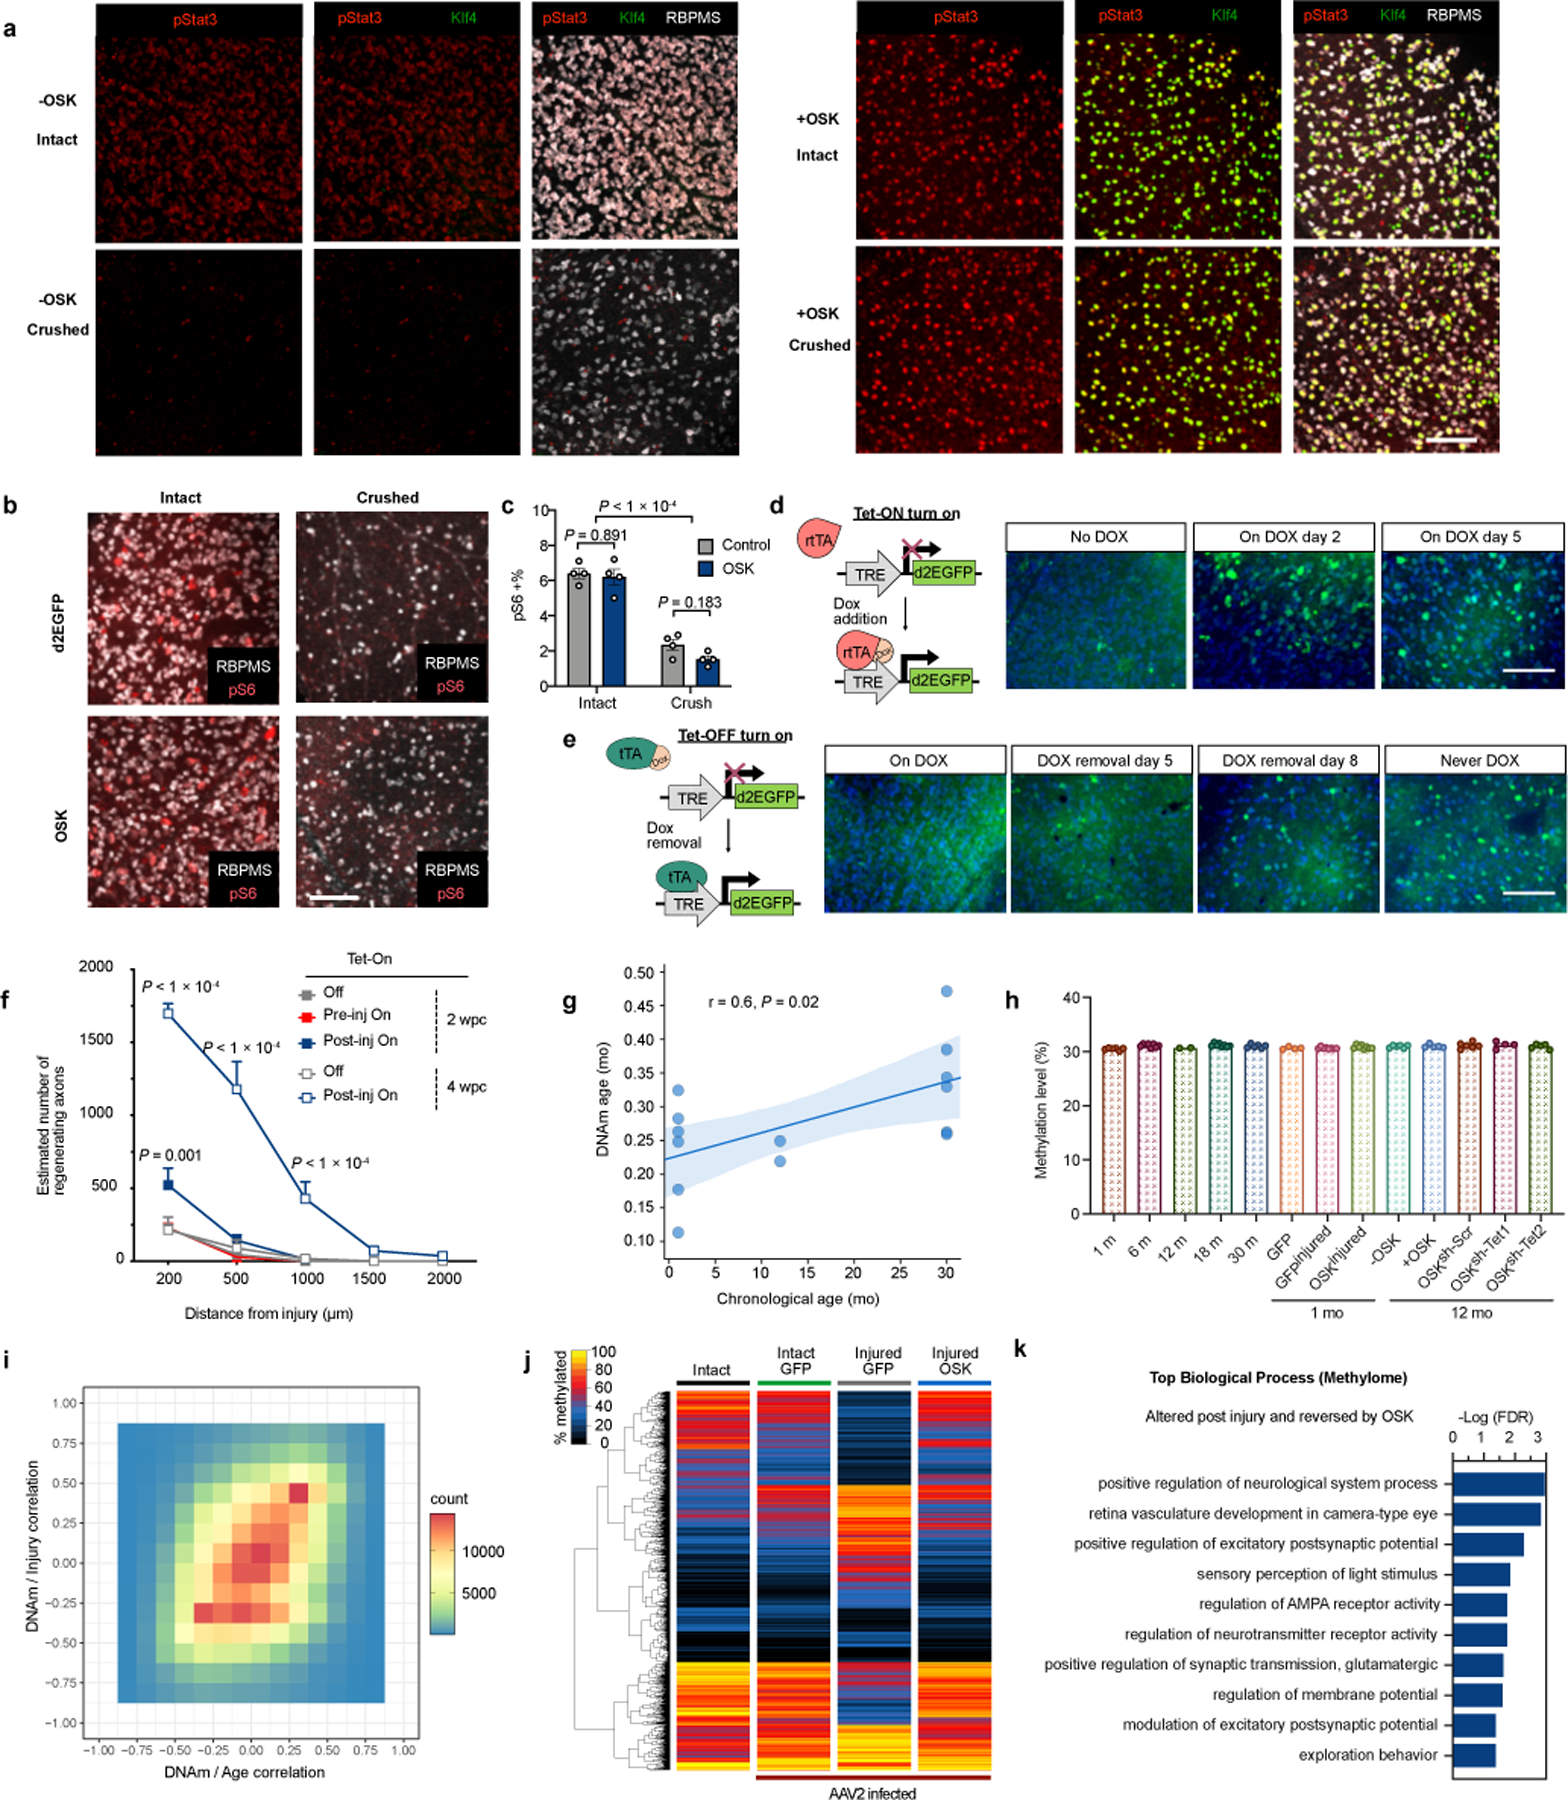
OSK activates Stat3 in the absence of mTOR activation or global demethylation.
a, Representative images of retinal wholemounts transduced with AAV2-tTA (−OSK) or AAV2-tTA;TRE-OSK (+OSK) in the presence or absence of crush injury after 3 days. Retinal wholemounts immunostained for pStat3, Klf4, and RBPMS. n = 2 retinas each condition. b, Representative images of retinal wholemounts transduced with d2EGFP- or OSK-encoding AAV2 in the presence or absence of a crush injury. Retinal wholemounts immunostained for RBPMS and mTOR activation marker phosphorylated S6 (pS6). n = 4 retinas each condition. c, Percent of pS6-positive RGCs in intact and crushed samples (n = 4 retinas each condition). d, Representative images of d2EGFP in retina expressed from the Tet-On AAV system. No GFP expression was observed in the absence of Dox. GFP expression reached peak levels 2 days after Dox induction and remained at a similar level at day 5 after induction. n = 2 retinas each condition. e, Representative images of retinal d2EGFP expression using the Tet-Off AAV system with various durations of Dox treatments (2 mg/mL). Once pre-treated with Dox to suppress expression (on Dox), GFP was sparse even on day 8 after Dox withdrawal, lower than peak expression (Never Dox). n = 2 retinas each condition. f, Axon regeneration at 2 or 4 wpc in response to OSK induction either pre- or post-injury (n = 4, 5, 5, 4, and 4 eyes, respectively). g, Correlation between ribosomal DNAm age (mo) and chronological age (mo) of sorted mouse RGCs (1 mo, n = 6; 12 mo, n = 2; 30 mo, n = 5), with the light blue region representing the confidence interval. P value of the linear regression is calculated by two-sided F-test of overall significance. In agreement with previous studies, DNAm age estimates of neurons tend to be lower than their chronological age but remain correlated (see Methods). h, Average DNA methylation levels across the mouse genome in RGCs from different ages and treatments, based on 703,583 shared CpG sites from RRBS of all samples (combined strands), n = 6, 8, 2, 8, 6, 4, 8, 8, 6, 5, 6, 4, and 5, respectively. i, Correlation of DNAm at each CpG site versus age (x-axis; 1 mo, 12 mo, 30 mo) and versus injury (y-axis; intact, injured GFP). Heatmap represents the number of sites located in each block of value coordinates. Pearson’s correlation coefficient, r = 0.34, P < 1e−200. j, Hierarchical clustered heatmap of methylation levels of 4,106 CpGs that significantly changed in RGCs after crush injury (Intact vs Injured GFP, q < 0.05) and the effect of OSK. k, Top biological processes associated with the 698 CpGs that were significantly altered by both injury and OSK. Two-way ANOVA with Bonferroni correction in c and f. Scale bars, 100 µm in a, b, d, e. All data are presented as mean ± s.e.m.
Extended Data Fig. 6
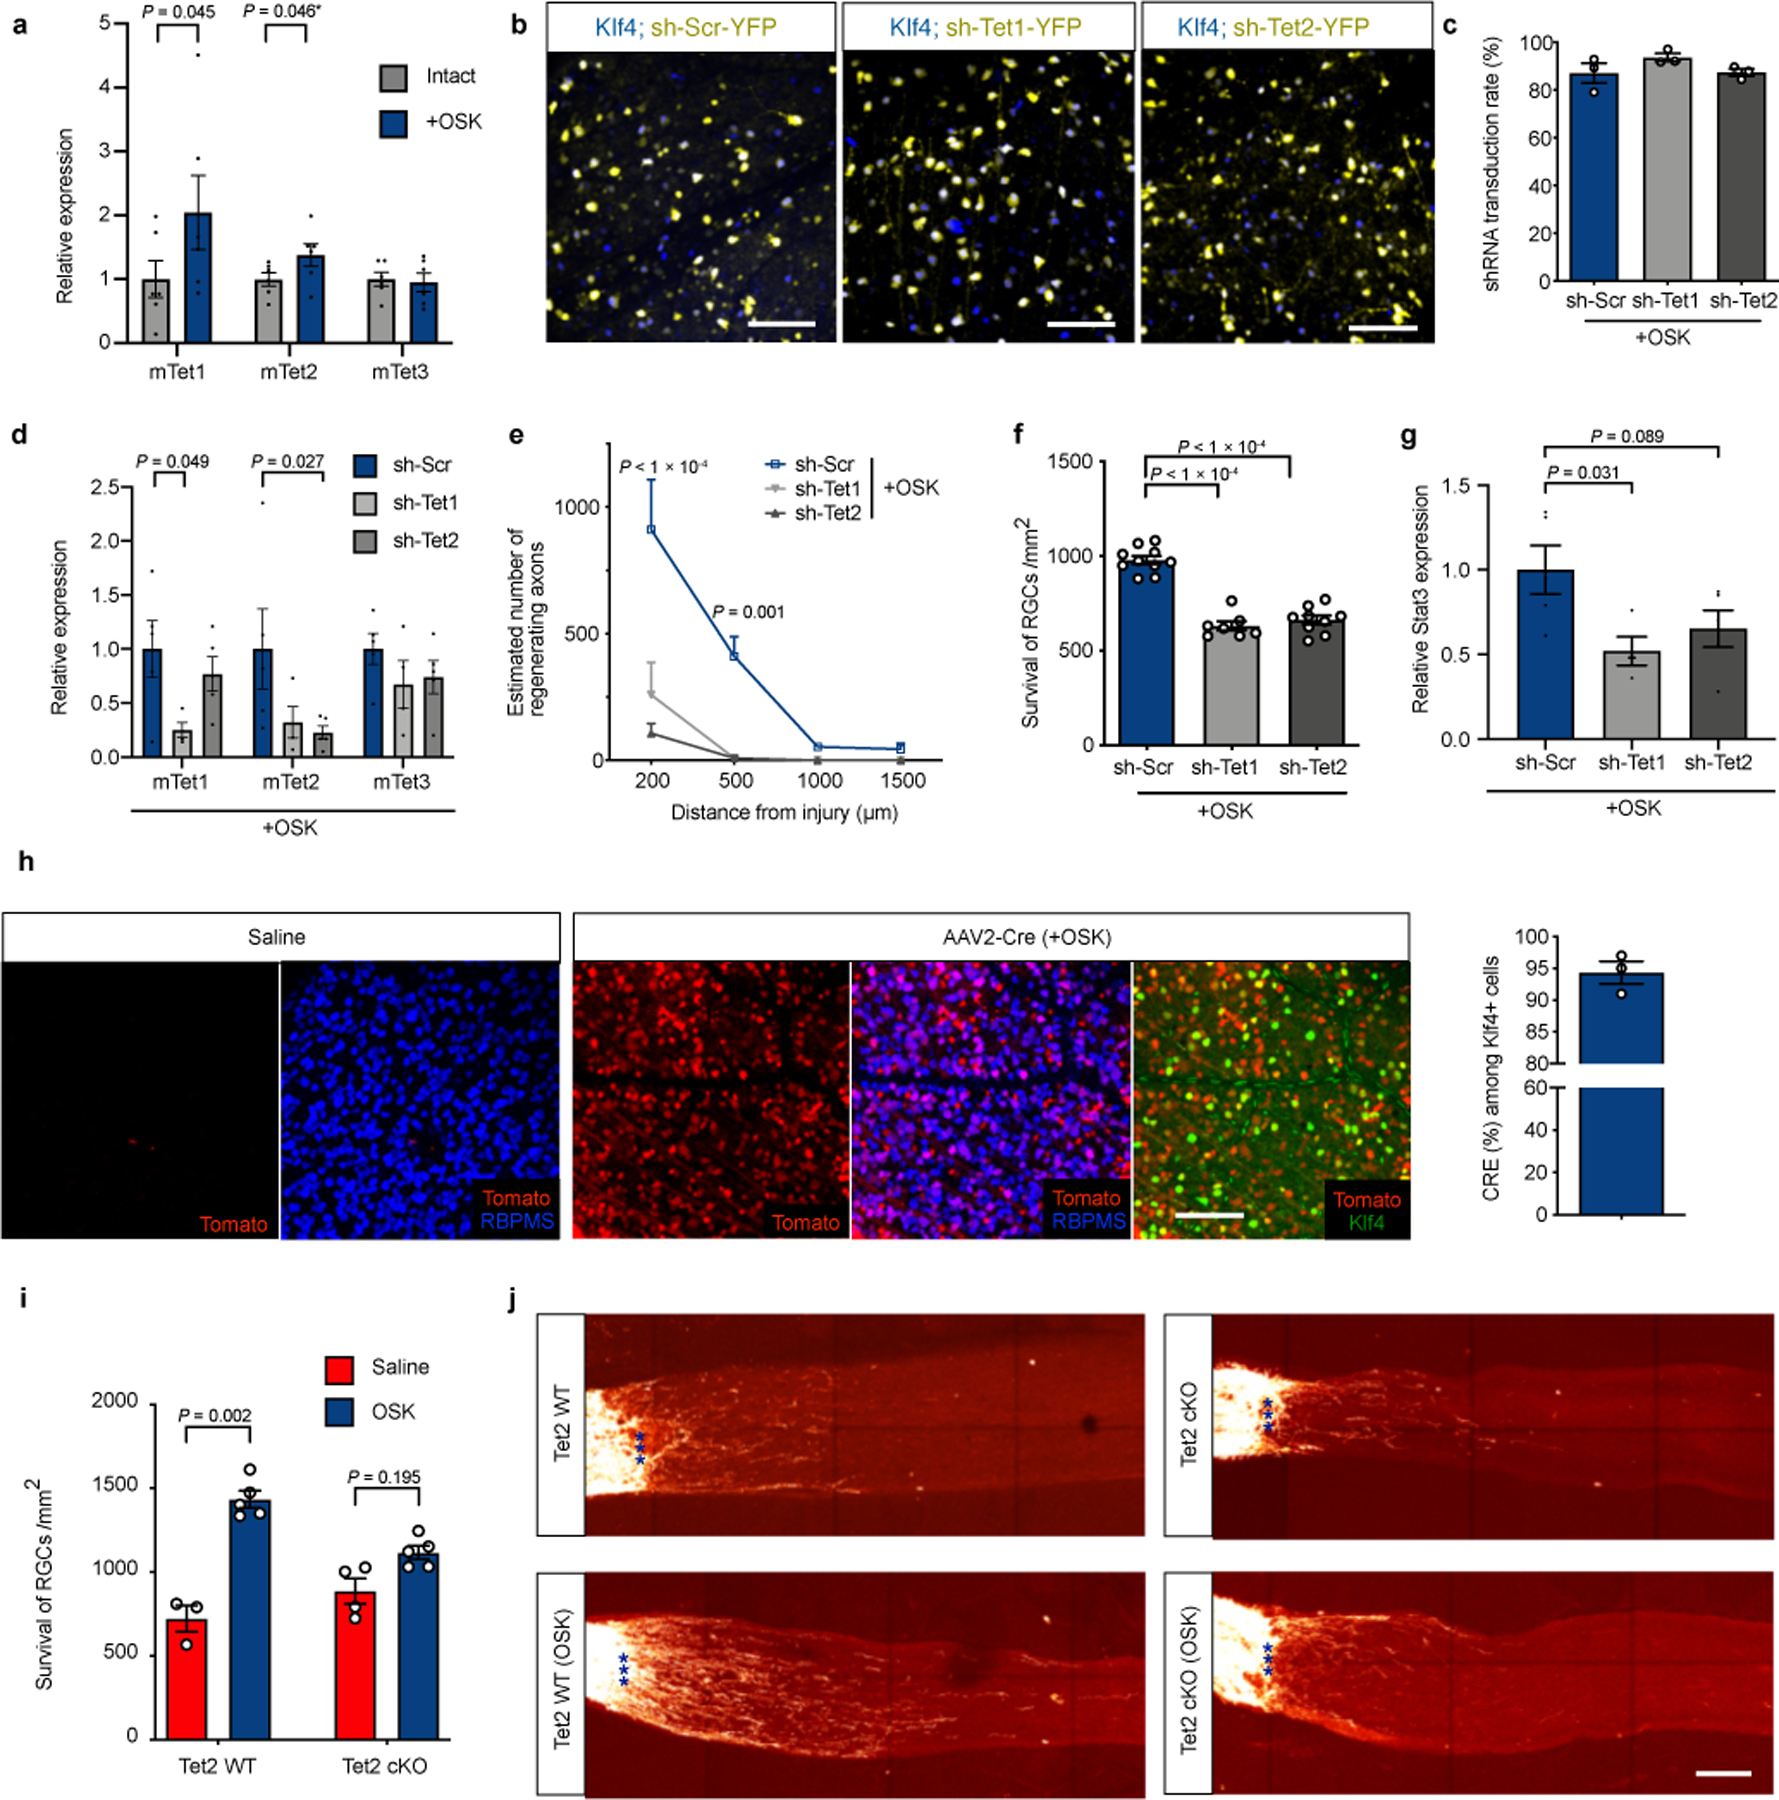
Protective and regenerative effect of OSK is dependent on Tet1/2.
a, Mouse Tet mRNA levels with or without OSK expression in RGCs (n = 6 biological replicates each condition). * Unpaired one-tailed t-test. b, Representative images of retinal wholemounts transduced with AAV2-tTA;TRE-OSK in combination with a AAV2-shRNA-YFP (yellow fluorescent protein) having either a scrambled sequence (sh-Scr) or a hairpin sequence to knockdown Tet1 (sh-Tet1) or Tet2 (sh-Tet2) expression, at titer ratio 5:5:1. Retinal wholemounts immunostained for Klf4. n = 3 retinas each condition. c, Quantification of shRNA-YFP AAV transduction in OSK-expressing RGCs (n = 3 retinas each condition). d, Mouse Tet mRNA levels with sh-Scr (n = 5), sh-Tet1 (n = 4), or sh-Tet2 (n = 5) YFP AAV2 in RGCs in the presence of OSK expression. e and f, Quantification of axon regeneration (e, n = 4 eyes each condition) and RGC survival (f, n = 10, 7, and 9 eyes) at 2 wpc in retinas co-transduced with AAV2- tTA;TRE-OSK;shRNA. g, Mouse Stat3 mRNA levels after sh-Scr (n = 5), sh-Tet1 (n = 4), or sh-Tet2 (n = 5) knockdown in RGCs in the presence of OSK expression. h, Cre-dependent Tomato expression in RGCs after intravitreal AAV2-Cre injection of Tomato reporter mice (Rosa-CAG-lox-STOP-lox-Tomato), and the co-expressed frequency of Cre and Klf4 (n = 3 eyes). i and j, RGC survival (i) and representative longitudinal sections of regenerating axons in longitudinal sections (j) in response to OSK expression (AAV2-tTA;TRE-OSK, n = 5 each condition) compared to no expression (Saline, n = 3 and 4) , 16 days after crush injury in Tet2flox/flox mice injected with saline (Tet2 WT) or AAV2-Cre (Tet2 cKO). Scale bars, 100 µm in b, h, and j. Two-way ANOVA in a, d, and i; unpaired two-tailed Student’s t-test in g; one-way ANOVA in e and f. All data are presented as mean ± s.e.m.
Extended Data Fig. 7
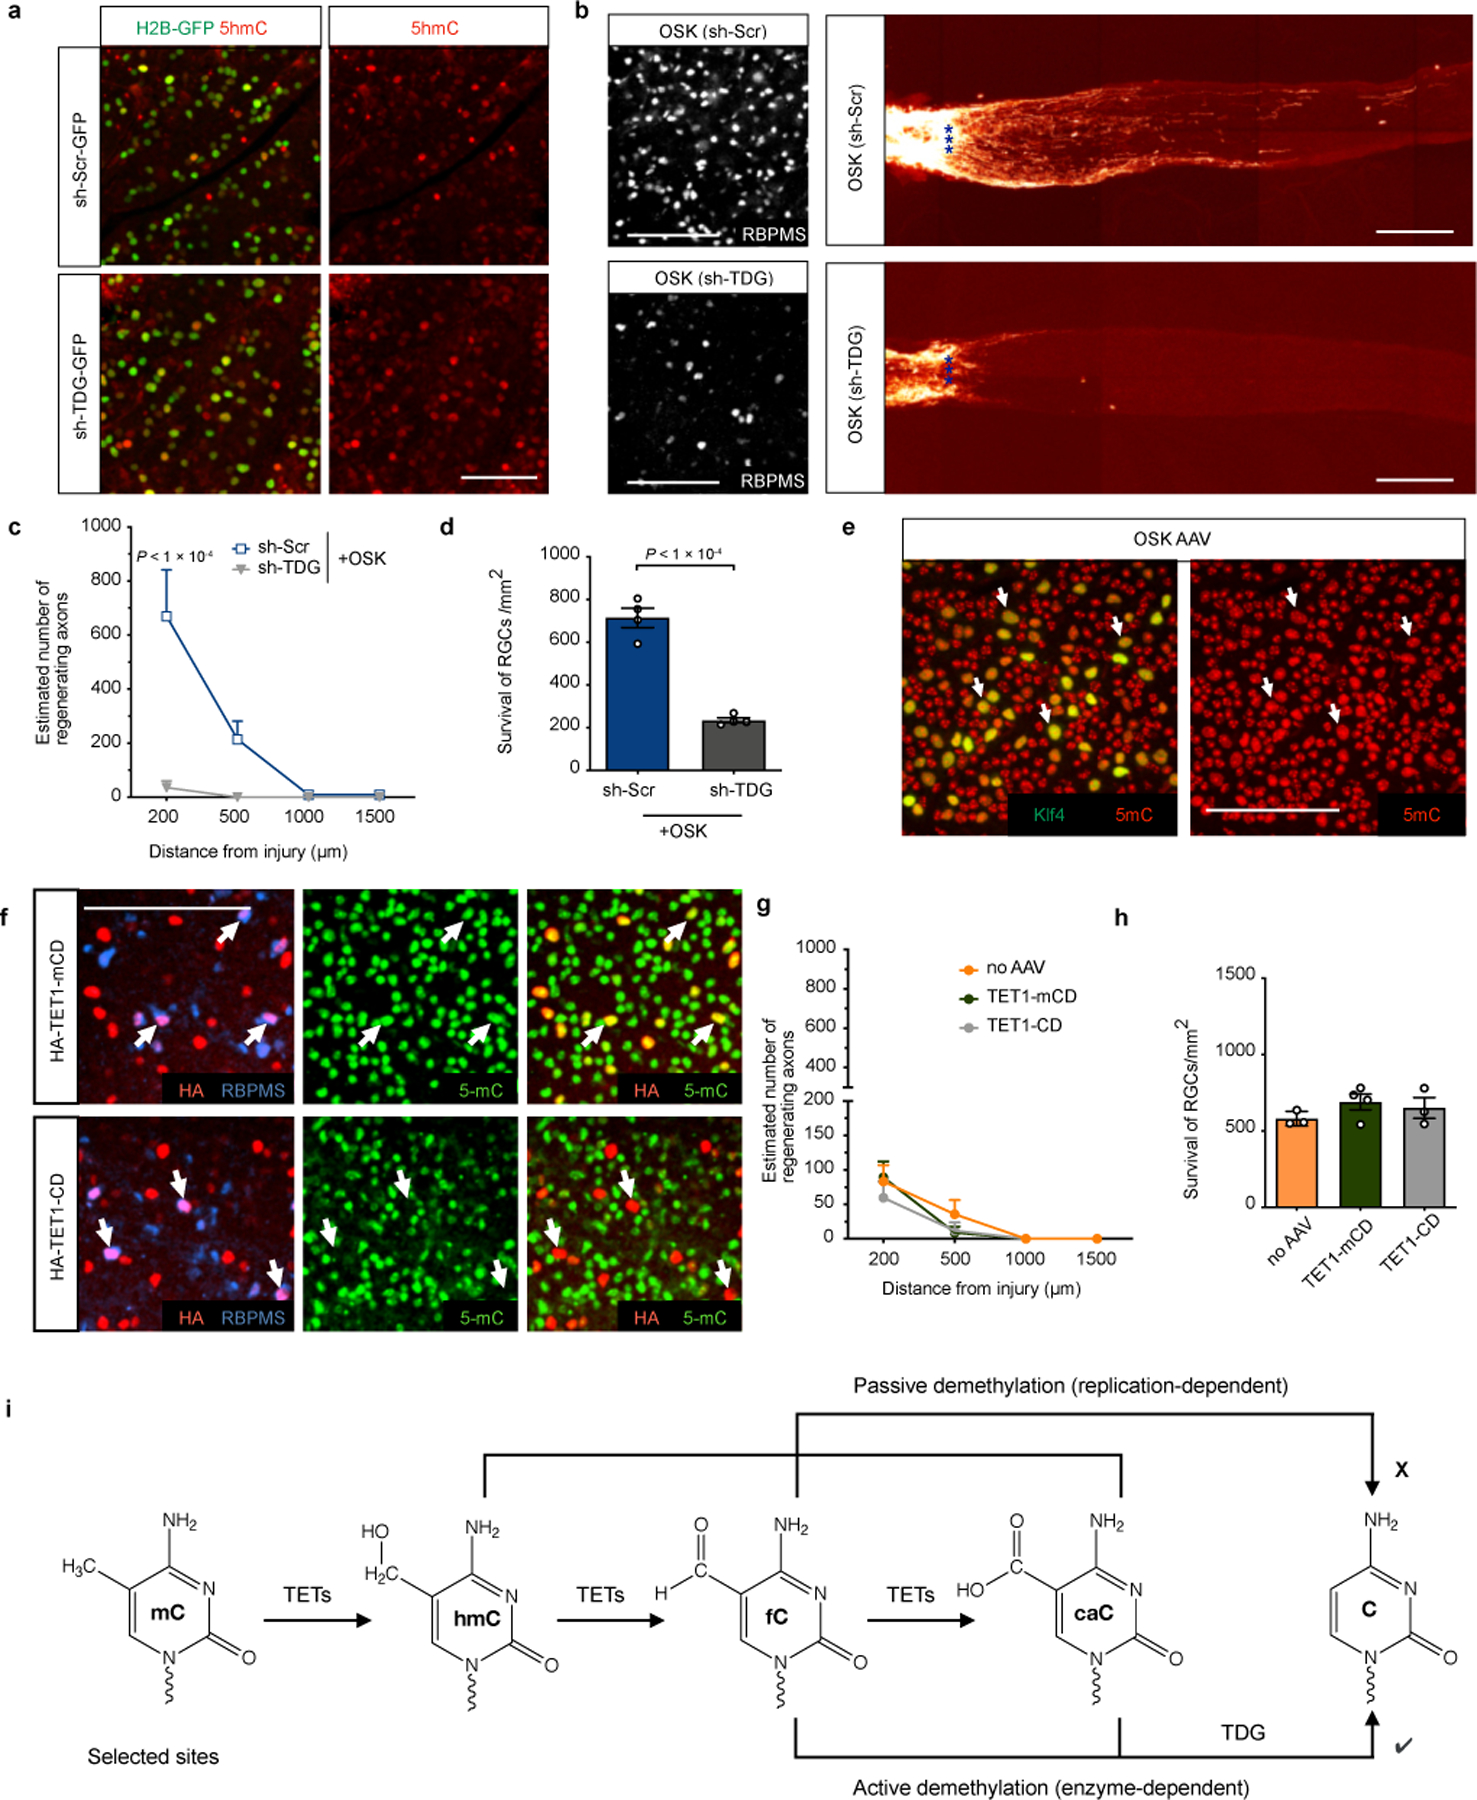
OSK-induced axon regeneration and survival require non-global active DNA demethylation through TDG.
a, Representative images of retinal wholemounts transduced with sh-Scr-H2B-GFP or sh-TDG-H2B-GFP AAV2s for 4 weeks, demonstrating TDG knockdown increased levels of 5-hydroxymethylcytosine (5-hmC). n = 4 retinas each condition. b, Representative retinal wholemount images and images of longitudinal sections through the optic nerve showing CTB-labeled regenerative axons in wild-type mice, 16 dpc after an intravitreal injection of AAV2-tTA ;TRE-OSK in combination with AAV2-sh-Scr (sh-Scr) or AAV2-sh-TDG (sh-TDG) at titer ratio 5:5:1. n = 4 retinas each condition. c and d, Quantification of regenerating axons (c) and RGC survival (d) in OSK-treated mice 16 dpc with AAVs carrying sh-Scr or sh-TDG (n = 4 nerves each condition). e, Representative image of retinal wholemounts transduced with AAV2-tTA;TRE-OSK. Retinal wholemounts were immunostained for 5-methylcytosine (5-mC) and Klf4, showing a lack of global demethylation in OSK expressing RGCs. n = 3 retinas. f, Representative images of retinal wholemounts transduced with AAV2 vectors encoding the HA-Tet1 catalytic domain (Tet1-CD) or its catalytic mutant (Tet1-mCD) for 4 weeks, demonstrating overexpression of Tet1-CD decreases global 5-mC levels. n = 3 retinas each condition. g and h, Quantification of axon regeneration (g) and RGC survival (h) at 2 wpc in retinas transduced without or with AAV2 vectors encoding HA-Tet1 CD mutant or HA-Tet1 CD (n = 3, 4, and 3 eyes). i, A schematic diagram illustrating passive demethylation and TDG-dependent active DNA demethylation. Scale bars, 100 µm in a b, e, and f. One-way ANOVA with Bonferroni’s multiple comparison test in c, g, and h; unpaired two-tailed Student’s t-test in d. There was no difference between the groups in g and h using two-way ANOVA and one-way ANOVA, respectively. All data are presented as mean ± s.e.m.
Extended Data Fig. 8
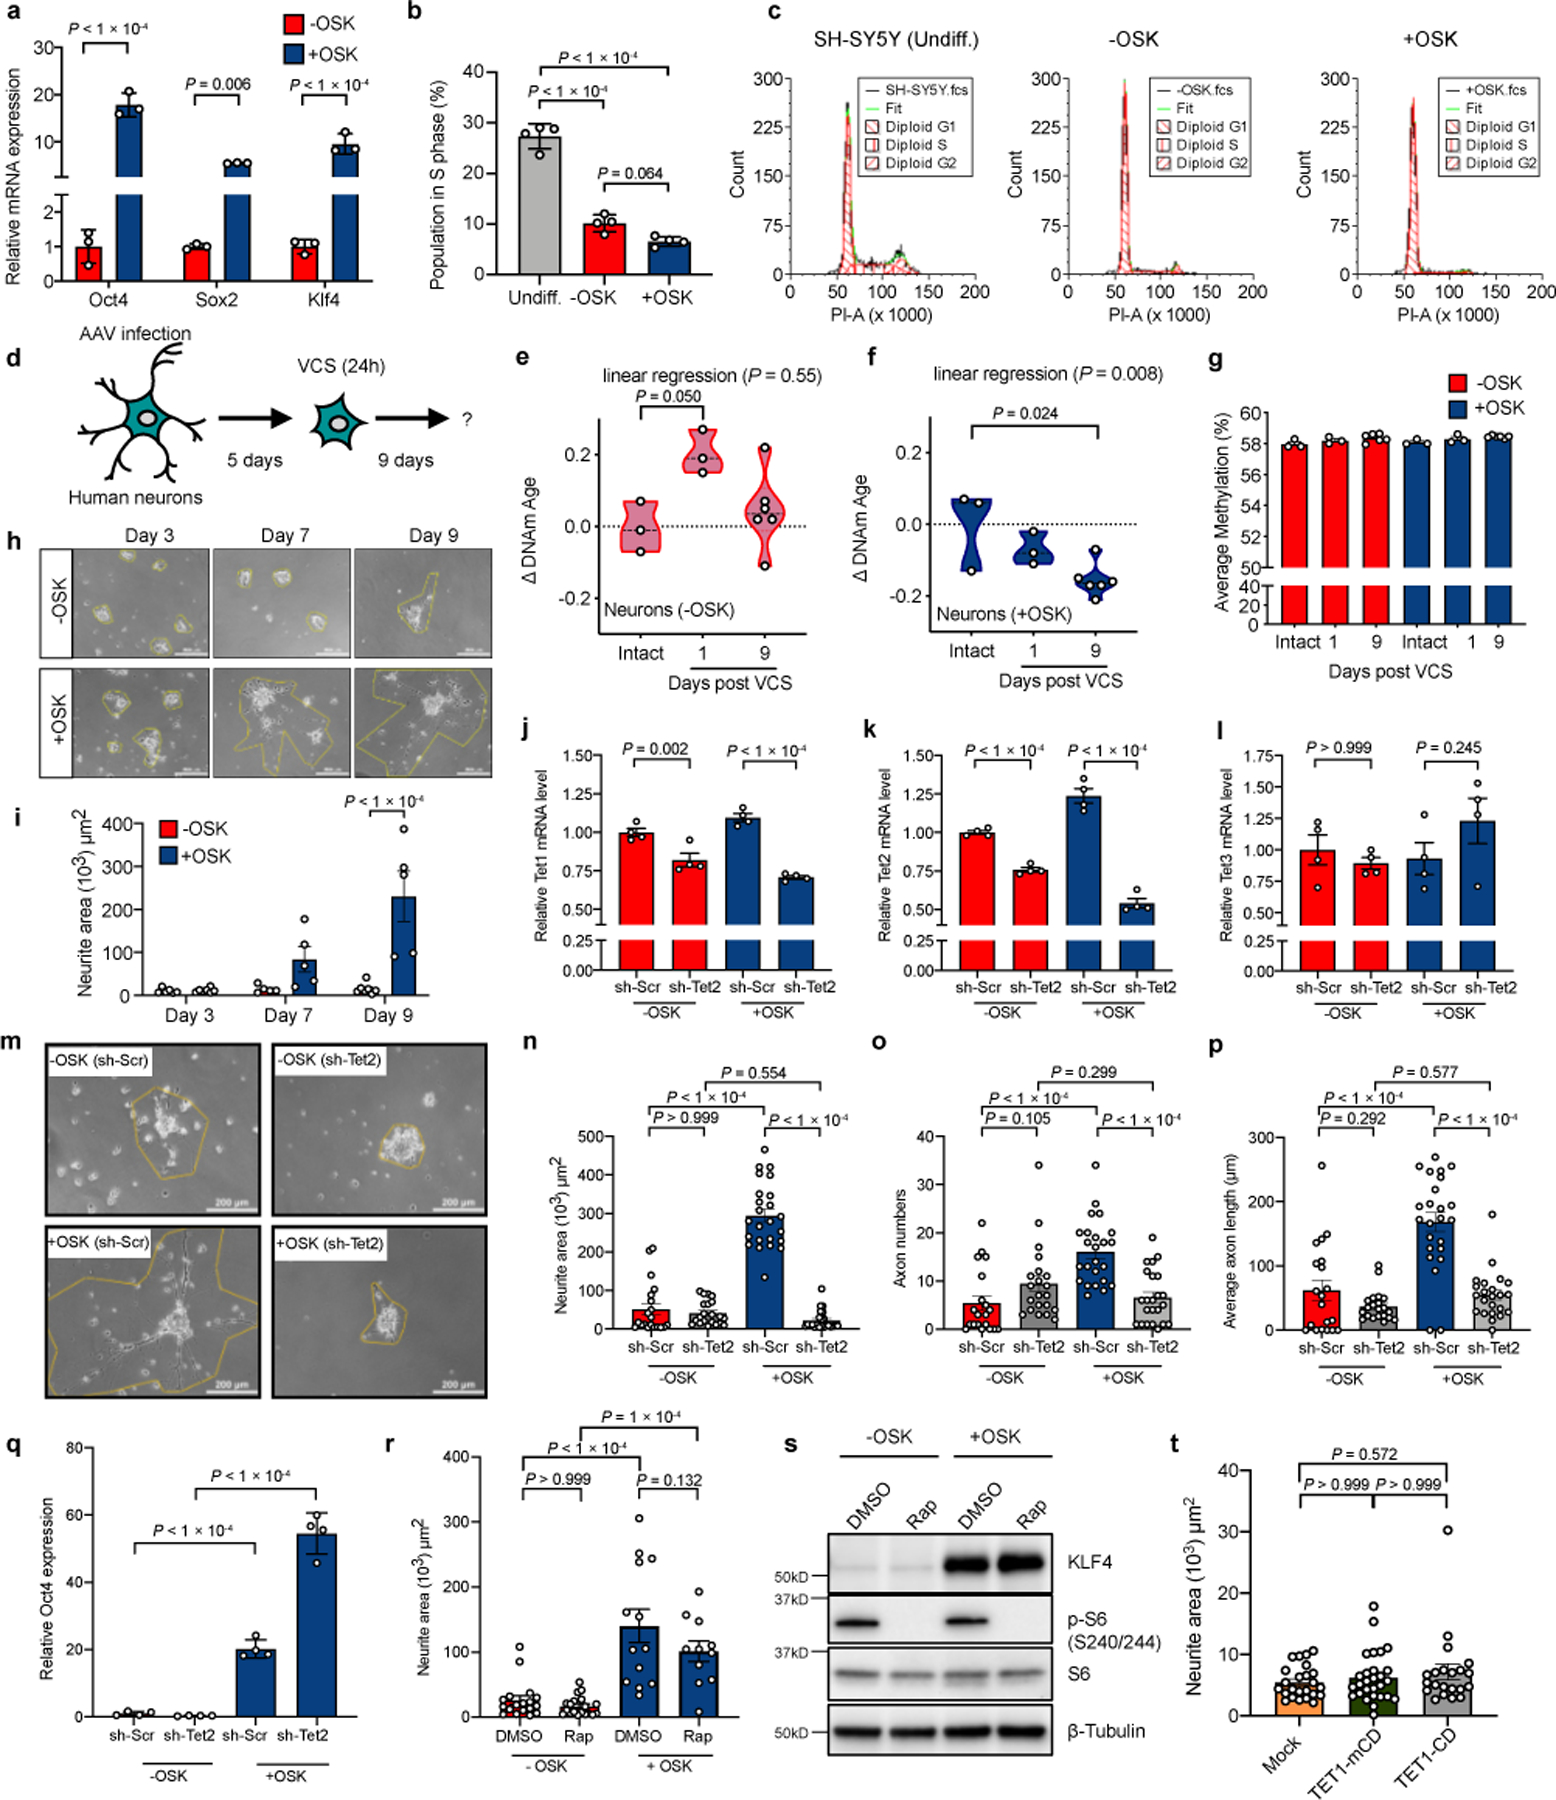
OSK induces axon regeneration and reversal of DNAm age in human neurons.
a, mRNA levels of murine Oct4, Sox2, and Klf4 in human neurons transduced with vectors packaged by AAV-DJ, a recombinogenic hybrid capsid that is efficient for in vitro transduction. −OSK: AAV-DJ-tTA (n = 3); +OSK: AAV-DJ-tTA;TRE-OSK (n = 3). b, Percentage of cells in S phase by PI-staining (n = 4). c, FACS profiles of G1, S, and G2 phases in undifferentiated SH-SY5Y cells and differentiated cells transduced with −OSK and +OSK vectors. d, Experimental outline for testing axon regeneration in human neurons post-vincristine (VCS) damage. e and f, DNA methylation (DNAm) age of human neurons without damage (intact), and 1 or 9 days post-VCS damage in the absence (e) or presence (f) of OSK expression, measured using the skin and blood clock suited to in vitro studies (see Methods). The linear regression P value in e (P = 0.55) indicates non-linear DNAm age changes, and in f (P = 0.008) indicates a continuous decrease in DNAm age (n = 3, 3, and 6). g, Average DNAm levels among 850,000 probes from the EPIC array in human neurons without damage (intact), and 1 or 9 days post-VCS damage in the absence or presence of OSK expression (n = 3, 3, and 6). h and i, Representative images (h, similar results were confirmed in two series of experiments) and quantification (i) of neurite area at different time points after VCS damage (n = 6, 7, 5, 5, 7, and 5; 2 independent experiments). Cells were not passaged after damage to avoid cell-cell contact for quantifying maximum axon regeneration. j-l, Human Tet1–3 mRNA level with scrambled shRNA (sh-Scr) or sh-Tet2 AAV in human neurons in the presence or absence of OSK expression (n = 4; 2 independent experiments). m, Representative images of human neurons in each AAV treated group, 9 days post-VCS damage. Similar results were confirmed in three series of experiments. n-p, Neurite area (n), axon number (o), and axon length (p) in each AAV-treated group 9 days post-VCS damage (n = 20, 21, 24, and 23; 3 independent experiments). q, Mouse Oct4 mRNA levels (from OSK AAV) in human neurons with sh-Scr or sh-Tet2 AAV and in presence or absence of OSK AAV (n = 4). r, The effect of mTOR inhibition by rapamycin (Rap, 10 nM) on axon regeneration of differentiated neurons with or without OSK (n = 18, 19, 13, and 11; 2 independent experiments). s, S6 phosphorylation levels in human neurons 5 days after treatment with rapamycin (Rap, 10 nM). Similar results were seen in two independent experiments. Uncropped scans in Supplementary Figure 1. t, Neurite area of neurons expressing Tet1 catalytic domain (Tet1-CD) or its catalytic mutant (Tet1-mCD) 9 days post-VCS damage (n = 24, 28, and 21; 2 independent experiments). One-way ANOVA with Bonferroni’s multiple comparison test in b, e, f, g, and t; two-way ANOVA with Bonferroni’s multiple comparison test in a, i, j–l, and n–r. All bar graphs are presented as mean ± s.e.m.
Extended Data Fig. 9
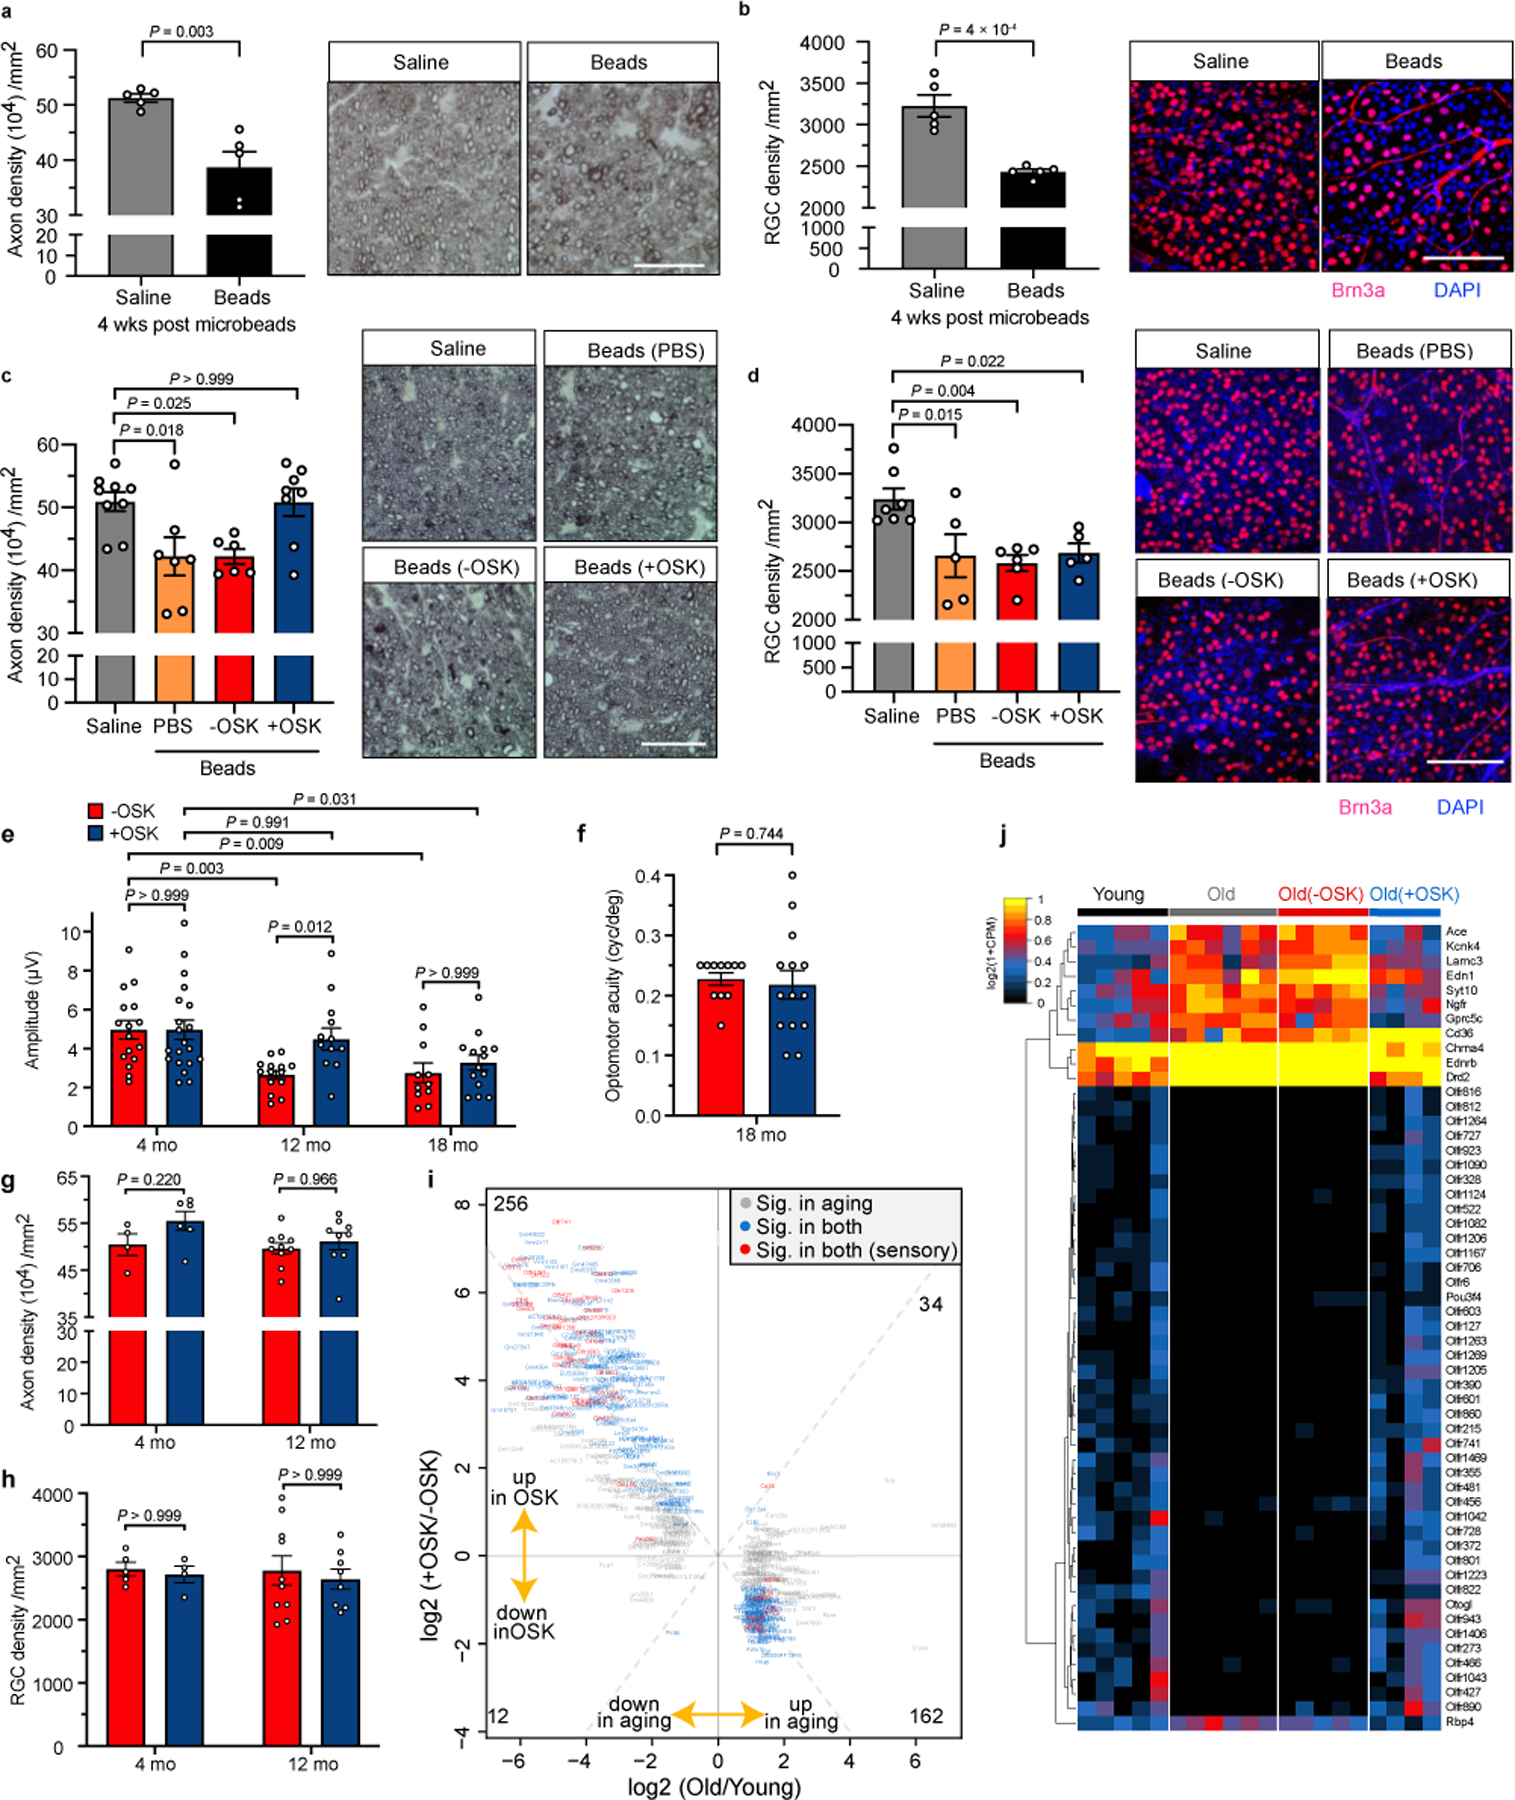
Vision restoration and regenerative effect of OSK rely on functional improvement of existing RGCs.
a, Axon density and representative photomicrographs of PPD-stained optic nerve cross-sections, 4 weeks after microbead or saline injection (baseline, n = 5 eyes each condition). Scale bars, 25 µm. b, Quantification of RGCs and representative confocal microscopic images from retinal flat-mounts stained with anti-Brn3a (red), an RGC-specific marker, and DAPI (4′,6-diamidino-2-phenylindole, blue), a nuclear stain, 4 weeks after microbead or saline injection (baseline, n = 5 eyes each condition). Scale bar, 100 µm. c, Axon density and representative micrographs from PPD-stained optic nerve cross-sections, 4 weeks after AAV2 or PBS injection (treated, n = 9, 7, 6, and 8 eyes). Scale, 50 µm. d, Quantification of RGCs and representative confocal microscopic images 4 weeks post-PBS or AAV injection (treated, n = 7, 5, 6, and 5 eyes). Scale bar, 100 µm. e, PERG measurement at different ages 4 weeks after −OSK (n = 16, 14, and 11 eyes) or +OSK treatment (n = 20, 12, and 14 eyes). Similar results from 2 independent experiments are combined. f, Visual acuity in 18-month-old mice treated with −OSK (n = 11 eyes) or +OSK AAV (n = 14 eyes) for 4 weeks. g and h, Axon (g, n = 4, 6, 10, and 9 nerves) and RGC (h, n = 5, 4, 10, and 8 retinas) density in 4- and 12-month-old-mice, 4 weeks after −OSK or +OSK AAV injection. i, Scatter plot of OSK-induced changes and age-associated changes in mRNA levels in RGCs, with differentially expressed genes labelled. Gene selection criteria are in Methods. j, Hierarchical clustered heatmap showing relative mRNA levels of age-associated sensory perception genes in FACS-sorted RGCs from untreated young (5 mo) or old mice (12 mo) or old mice treated with either −OSK or +OSK AAV. Sensory genes were extracted from the mouse Sensory Perception (GO:0007600) category the Gene Ontology database, including genes that were differentially expressed (q < 0.05) in 12- versus 5-month-old mice, excluding genes that were induced by the empty virus infection (q < 0.1). −OSK: AAV2-rtTA;TRE-OSK for c–h, AAV2-TRE-OSK for i and j; +OSK: AAV2-tTA;TRE-OSK for c-j. Unpaired two-tailed Student’s t-test in a, b, and f; one-way ANOVA with Bonferroni’s multiple comparison test in c and d; two-way ANOVA with Bonferroni correction in e, g, and h. All data are presented as mean ± s.e.m.
Extended Data Fig. 10
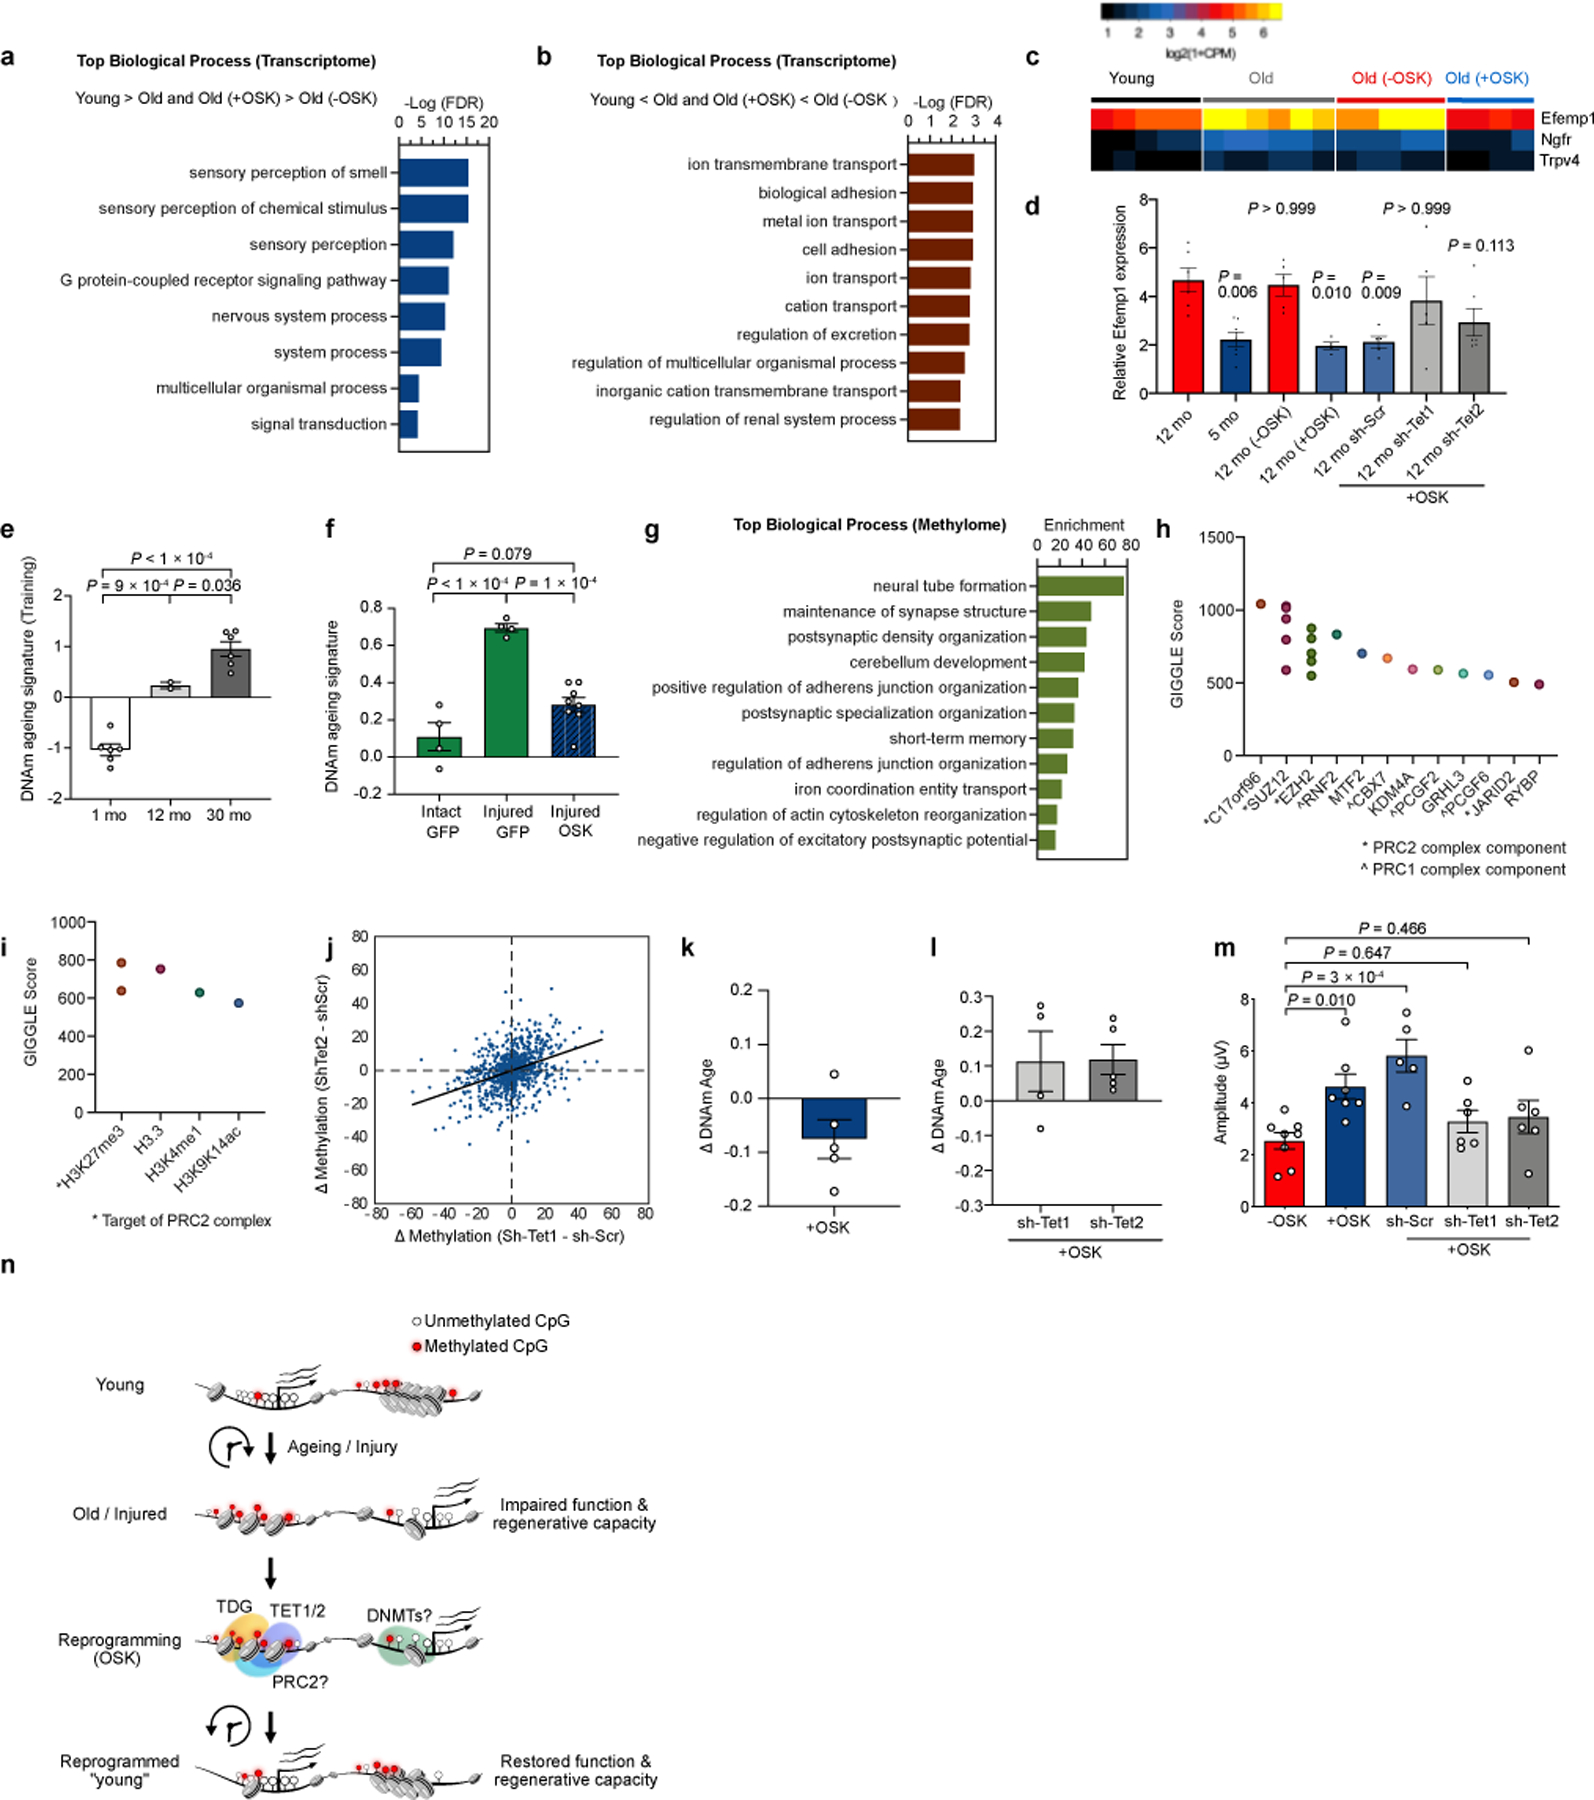
OSK expression in old RGCs restores youthful epigenetic signatures.
a and b, Top biological processes based on transcriptome data that were either lower expressed in old compared to young RGCs and reversed by OSK (a), or higher expressed in old RGCs compared to young and reversed by OSK (b). c, Heatmap showing relative mRNA levels of genes involved in the negative regulation of neural projection development, among the 464 differentially expressed genes during ageing. Efemp1 is a gene whose accumulation during ageing is suspected to play a role in diseases of the retina. d, RGC Efemp1 mRNA levels measured by qPCR (relative to GAPDH) compared between young, old, and old treated with −OSK or + OSK AAV. Old RGCs with sh-Scr, sh-Tet1, or sh-Tet2 knockdown combined with +OSK AAV are included for comparison (n = 7, 6 ,5, 4, 5, 5, and 6 eyes). e, Principal Component 1 value of 1 mo, 12 mo, and 30 mo RGC training samples in the PCA analysis. Values are standardized to have a mean=0 and s.d.=1 (n = 6, 2, and 6). f, DNAm ageing signatures of 6-week-old RGCs isolated from axon-intact retinas infected with GFP-expressing AAV, or from axon-injured retinas infected with GFP- or OSK- expressing AAV at 4 dpc (n = 4, 4, and 8 eyes). g, Top biological processes associated with the 1,226 signature CpG sites. h and i, Transcription factor (TF) binding (h) and histone modifications (i) specifically enriched at the 1,226 signature CpG sites, compared to five sets of randomly selected CpGs. j, Correlation of Tet1 and Tet2 knockdown-induced changes in methylation (5-mC and 5-hmC together) at the selected CpGs. r = 0.4, P = 2.53e-45. k, Delta value of ribosomal DNAm age (mo) of 12-month-old RGCs infected for 4 weeks with +OSK (n = 5 retinas). Values are relative to the average of RGCs infected with −OSK AAV. l, Ribosomal DNAm age (mo) of 12-month-old OSK-treated RGCs infected for 4 weeks with sh-Tet1 or sh-Tet2 (n = 4, 5 retinas). Values are relative to the average of RGCs infected with sh-Scr. m, PERG amplitudes in old mice (12 mo) treated with −OSK, +OSK, or +OSK together with either sh-Scr or sh-Tet1/sh-Tet2-mediated knockdown for 4 weeks (n = 8, 7, 5, 6, and 6 eyes). n, Working model. The loss of youthful epigenetic information during ageing and injury (including genome-wide changes to DNA methylation, acceleration of the DNAm clock, and disruption of youthful gene expression patterns) causes a decline in tissue function and regenerative capacity. OSK-mediated reprogramming recovers youthful epigenetic information, reverses the DNAm clock, restores youthful gene expression patterns, and improves tissue function and regenerative capacity, a process that requires active DNA demethylation by TET1/TET2 and TDG. The PRC2 complex may serve to recruit TET1 and TET2 to specific sites in the genome, and DNA methylation by DNA methyltransferases (DNMTs) may be important as well. One-way ANOVA with Bonferroni’s multiple comparison test in d, e, f and m. All data are presented as mean ± s.e.m.
Content retrieved from: https://www.ncbi.nlm.nih.gov/pmc/articles/PMC7752134/.