DNA Methylation Clocks and Their Predictive Capacity for Aging Phenotypes and Healthspan
The number of age predictors based on DNA methylation (DNAm) profile is rising due to their potential in predicting healthspan and application in age-related illnesses, such as neurodegenerative diseases. The cumulative assessment of DNAm levels at age-related CpGs (DNAm clock) may reflect biological aging. Such DNAm clocks have been developed using various training models and could mirror different aspects of disease/aging mechanisms. Hence, evaluating several DNAm clocks together may be the most effective strategy in capturing the complexity of the aging process. However, various confounders may influence the outcome of these age predictors, including genetic and environmental factors, as well as technical differences in the selected DNAm arrays. These factors should be taken into consideration when interpreting DNAm clock predictions. In the current review, we discuss 15 reported DNAm clocks with consideration for their utility in investigating neurodegenerative diseases and suggest research directions towards developing a more optimal measure for biological aging.
Introduction
In contrast to the steady pace of chronological age, the pace of biological age varies among individuals and may predict distinct aspects of aging at different life stages. For example, biological aging later in life reflects the link with disease, morbidity, and mortality, whereas in youth/midlife, it might predict healthspan or cognitive/physical decline (eg, individuals aging more rapidly are less cognitively/physically able).1,2 As chronological age does not sufficiently represent fundamental aging processes, methods to measure biological aging have been developed, which is important for assessing strategies to slow down biological aging and extend healthspan. A reliable measure of biological age could be a factor in predicting disease onset in presymptomatic carriers of causal mutations, and assist in the development of preventive rather than therapeutic strategies.1
Technical breakthroughs have led to the discovery of several molecular markers of aging, including epigenetic biomarkers.3-6 For instance, genome-wide RNA-interference-based screening in Caenorhabditis elegans revealed a conserved epigenetic mechanism, which implicated 59 genes as modulators of age-related behavioural deterioration rate.7 Two neuronal genes were among the most prominent hits: epigenetic reader (BAZ-2) and histone 3 lysine 9 methyltransferase (SET-6), which could accelerate behavioural deterioration by repressing the expression of nuclear-encoded mitochondrial proteins. Importantly, the expression of human orthologues (BAZ2B and EHMT1) in the frontal cortex increases with age and correlates with Alzheimer disease (AD) progression.
Among biomarkers of aging, such as telomere length (TL), metabolomic, transcriptomic and proteomic variations, the most promising are based on the DNA methylation (DNAm) of cytosines at CpG dinucleotides,8 representing one of the key epigenetic mechanisms altering gene expression or splicing. The cumulative assessment of DNAm levels at age-related CpGs could be used as a DNAm clock,6,9-13 which may mirror biological aging (Figure 1). Although some clinical biomarkers outperform DNAm clocks in reflecting morbidity and mortality,14 the advantage of DNAm clocks is their ability to measure either multitissue or cell-/tissue-specific aging. DNAm clocks could help explain why some individuals stay healthy, whereas others develop age-related neurodegenerative diseases.
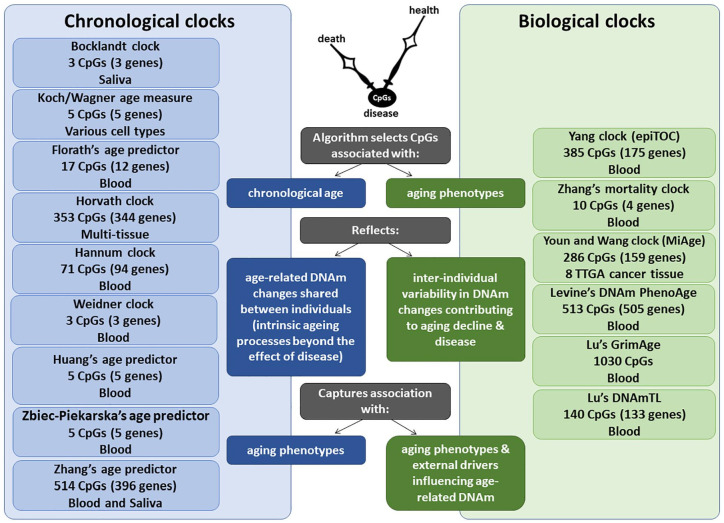
Comparison of chronological vs biological DNAm clocks. Each DNAm clock is developed using a unique training model, including a variable number of CpGs, tissue source of DNA and corresponding age-related measures. While chronological DNAm clocks reflect age-related DNAm changes that are shared between individuals and are expected to reflect the intrinsic aging process, biological DNAm clocks reflect age-related DNAm changes that vary between individuals and are expected to capture associations with specific age-related phenotypes and external drivers that may influence age-related DNAm.
Several studies support the link between DNAm clocks and biological age. DNAm-age acceleration (difference between DNAm-age and chronological age) was associated with major neurodegenerative diseases, such as AD,15 Parkinson disease (PD),16 Huntington disease17 and amyotrophic lateral sclerosis (ALS).18,19 Similarly, HIV-infected individuals exhibit premature aging based on methylome-wide changes and Horvath DNAm clock.20,21 Furthermore, individuals with Werner or Down syndromes also display accelerated DNAm clocks.22,23 In contrast, DNAm-age in centenarians is on average 9 years younger than their chronological age.24
However, it is mostly unclear what the underlying molecular mechanisms of DNAm clocks are. Do they reflect similar aspects of the aging process? What is their capacity to predict risk of decline before disease onset and therapeutic effectiveness aiming to extend healthspan? Here, we provide an overview of DNAm clocks, including their application in neurodegenerative diseases, potential confounders and gaps in the current knowledge.
Comparison of Different DNAm Clocks
Most DNAm clocks are based on a limited number of CpGs, which are widely distributed throughout the genome and mainly selected from the 27K or 450K BeadChips that have currently been replaced by the more informative EPIC chip covering 850K CpGs (Table 1). Age-related CpGs are overrepresented in the proximity of Polycomb-binding regions and promoters, which are key regulators of gene expression.6,11,13 The little overlap in CpGs between different DNAm clocks25-27 might be the result of several factors (eg, cell-/tissue-specific differences) and explain why some clocks are capable of catching certain outcomes better than others. In addition, the applied arrays might not include the most informative age-related CpGs.6,14 Many DNAm clocks are obtained from linear regression algorithms trained against chronological age6; however, clocks too perfectly trained on chronological age would not contain information on interindividual variability in biological age.5,6 Finally, some DNAm clocks focus on the comparison between DNAm levels and physiological measures of biological age (eg, cholesterol levels), which may be the consequence of confounding factors (eg, obesity) rather than representing aging itself.28
Table 1.
An overview of the different chronological and biological DNAm clocks, including the number of CpGs and genes used to build the clocks, the age range in which they can be applied, as well as the sample size, tissues and platforms used to develop the different DNAm clocks.
| DNAm clock | No. of CpGs (genes) | Age range | Sample size | Tissue | Platform | Reported associations | References |
|---|---|---|---|---|---|---|---|
| Chronological DNAm clocks | |||||||
| DNAm-age | 3 (3) | 18-70 | 68 | Saliva | Illumina 27 K | Chronological age | Bocklandt et al9 |
| Epigenetic-aging-signature | 19 (5) | 16-72 | 130 | Various cell types | Illumina 27 K | Chronological age | Koch and Wagner29 |
| Florath age predictor | 17 (12) | 50-75 | 400 | Blood | Illumina 450K | Chronological age | Florath et al30 |
| DNAm-age | 353 (344) | 0-101 | 8000 | Various cell & tissue types | Illumina 27K & 450K | Chronological age, all-cause mortality, cancer, age-related disease and several neurodegenerative phenotypes | Horvath11 |
| DNAm-age | 71 (94) | 19-101 | 656 | Blood | Illumina 450K | Chronological age, all-cause mortality | Hannum et al12 |
| DNAm-age | 3 (3) | 0-78 | 575 | Blood | Illumina 27K & 450K | Chronological age, clinical and lifestyle factors, telomere length and related diseases | Weidner et al13 |
| Huang age prediction model | 5 (5) | 9-75 | 89 | Blood | Pyrosequencing | Chronological age for forensics | Huang et al31 |
| Zbiec-Piekarska age predictor | 5 (5) | 2-75 | 420 | Blood | Pyrosequencing | Chronological age for forensics | Zbiec-Piekarska et al32 |
| Zhang age predictor | 514 (396) | 2-104 | 13 566 | Blood & saliva | Illumina 450K & EPIC | Chronological age | Zhang et al33 |
| Biological DNAm clocks | |||||||
| epiTOC | 385 (175) | 19-101 | 656 | Blood | Illumina 450K | Mitotic age, cancer risk | Yang et al34 |
| All-cause mortality clock | 10 (4) | 31–82 | 1000 | Blood | Illumina 450K | All-cause, cardiovascular disease and cancer mortality, cigarette smoking behaviour | Zhang et al35 |
| MiAge | 286 (159) | NA | 4020 | 8 TTGA cancer cells | Illumina 450K | Mitotic age, cancer risk, survival | Youn and Wang36 |
| DNAm PhenoAge | 513 (505) | >20 | 9926 | Blood | Illumina 27K, 450K & EPIC | All-cause and cause-specific mortality, survival, count of comorbidities, physical functioning, smoking status and telomere length | Levine et al14 |
| DNAm GrimAge | 1030a (NA) | NA (mean 66) | 1731 | Blood | Illumina 450K & EPIC | Morbidity and mortality, survival, cognitive decline, clinical biomarkers, lifestyle factors, blood cell composition and telomere length | Lu et al37 |
| DNAmTL | 140 (133) | 22-93 | 2256 | Blood | Illumina 450K & EPIC | Telomere length, chronological age, ethnicity, sex, lifestyle factors, mortality, morbidity, physical functioning | Lu et al38 |
Abbreviation: DNAm, DNA methylation.
Chronological DNAm clocks
An overview of all 9 reported chronological DNAm clocks is presented in the Table 1. The first DNAm clock was built by Bocklandt et al,9 using saliva DNA. The study identified 88 CpGs that correlated with the chronological age of 34 male identical twins (age, 21-55), of which 3 were replicated in a general cohort (n = 60; age, 18-70).9 However, DNAm clocks composed of only a few CpGs cannot be reliably used for multiple tissues.5 For instance, a high average error of age prediction (11 years) was reported for the ‘epigenetic-aging-signature’ of Koch and Wagner,29 containing 19 CpGs. Notably, the DNAm-age estimator of Weidner et al13 consists of only 3 CpGs, the analysis of which by bisulphite pyrosequencing revealed age prediction with an average error of 4.5 years; however, this estimator has a lower accuracy using the 450K BeadChip.39 Furthermore, it does not detect an association with mortality and revealed only a nominal correlation with TL or clinical and lifestyle measures (eg, alcohol consumption).
More accurate age predictions were reported with the rise in available data sets and advancements in technological/bioinformatic strategies. For example, Florath et al30 analysed blood DNA in 3 steps using a discovery (n = 965), replication (n = 400) and longitudinal cohort (67 individuals followed more than 8 years). It resulted in the selection of 17 CpGs to build a regression model for age prediction with an average error of only 2.6 years. However, the disadvantages of this DNAm clock are the use of a single tissue, the narrow age range of the cohort and the small number of selected CpGs (Table 1).
In contrast, Horvath11 multitissue clock consists of 353 CpGs and not significantly confounded by cell-/tissue-specific changes.5,40 It has been validated in multiple data sets, including ~8000 samples from 51 different cell and tissue types collected from both children and adults. Although the DNAm state of each CpG correlates only weakly with age, their combined effect results in an accurate biomarker of chronological age (an average error of 3-5 years). Additional measures of the Horvath clock include DNAm-age acceleration and intrinsic epigenetic age acceleration derived from adjusting DNAm-age for chronological age and blood cell proportions.41
The DNAm-age estimator of Hannum et al12 consists of 71 CpGs and is highly accurate in blood, but requires recalibration to achieve reasonable accuracy in other tissues. Both Hannum and Horvath clocks have a striking ability to predict all-cause mortality. They were built using a similar regression model for selecting age-related CpGs, and display moderate to strong correlations, even though they share only 6 CpGs.8 The Hannum clock and DNAm PhenoAge (discussed below) reflect age-related changes in cell and tissue-type composition.5 Notably, correcting for cell-/tissue-specific composition could eliminate biologically informative signals. For example, certain age-related diseases (eg, immunosenescence) are hallmarked by changes in the cellular structure of blood.5,42 Compared with intrinsic measures (consistent across cell/tissue types), extrinsic measures are more suitable for assessing age-related decline in specific tissues.5,41 DNAm-age acceleration measures are more informative, as they refer to discrepancies from the norm,5 and are associated with longevity and mortality giving the best representation of biological age.24,41,43
Zbiec-Piekarska et al32 analysed 41 CpGs by pyrosequencing of blood DNA (n = 420), of which 5 were included in an age predictor with an average error of 4.5 years. In a similar study, Huang et al31 analysed 38 different CpGs by pyrosequencing of blood DNA (n = 89), of which 5 were included in an age predictor with an average error of 7.9 years. In Zbiec-Piekarska clock, the mean absolute deviation varied from 5.0 for the oldest subgroup (age, 60-75) to 2.7 in the youngest subgroup (age, 2-19).32 The decreased accuracy of this clock in older people could reflect either technical issue(s) or the influence of external factors (eg, lifestyle). Several studies reported that DNAm changes slow down with age,6,12,13,44 which suggests the importance of including chronological age as a covariate. Furthermore, sex-specific differences were reported for Zbiec-Piekarska, Horvath and Hannum clocks, suggesting slightly faster aging in men than women, which could reflect either biological and lifestyle differences or technical issues affecting accuracy of the age predictors between the subgroups. Indeed, the mean absolute deviation of the Zbiec-Piekarska clock was marginally higher for men (3.7) than women (3.0).32
A recent large study by Zhang et al33 reported several DNAm predictors of chronological age based on the analysis of blood and saliva DNA. A near-perfect predictor of chronological age was developed using a training cohort covering a wide age range, which was further corrected for cellular composition. In nonblood tissues, it is comparable with the Horvath clock.11 However, the association between DNAm-age acceleration and mortality attenuates as prediction accuracy increases, which is likely the result of losing CpGs linked with biological age (during training overemphasizing the estimation of chronological age).
In summary, Horvath11 and Zhang33 clocks outperform other DNAm clocks based on either applicability to various cells/tissues or accurate prediction of chronological age, respectively. DNAm aging rate can be quite different between tissues,8 but clocks derived from a single tissue could be recalibrated to achieve a more accurate age prediction in another tissue.40 In general, tissue-specific clocks may better reflect age-related diseases,45 while multitissue clocks are more suited to capturing innate aging processes. Nevertheless, several studies reported associations between the acceleration of the Horvath multitissue clock and age-related disease risk or mortality, strongly supporting the potential of this clock as a disease biomarker.
Biological DNAm clocks
A summary of 6 biological DNAm clocks is presented in the Table 1. A mitotic-like biological DNAm clock (epiTOC) was reported by Yang et al.34 The 385 CpGs of epiTOC are mapped to the promoters of Polycomb target genes, which are unmethylated in fetal tissues, and their DNAm status correlates with the increasing rate of cell division during aging. This clock accelerates in premalignant and cancerous lesions, but has limitations in predicting cancer risk for a diverse range of tissues and capturing DNAm changes occurring postmitotically.34,45 Similarly, Youn et al36 developed a mitotic-like clock (MiAge) based on the hypothesis that somatic replication errors increase with a growing number of divisions. The MiAge clock comprised of 268 not tissue-specific CpGs, which display increased DNAm during mitotic activity. Although MiAge was built using large cohorts from 8 types of cancer or adjacent tissues, it could be applied as a general aging biomarker.36
A biological clock reported by Zhang et al35 is based on the blood DNAm signature of 10 CpGs correlating with risk of mortality. The computed mortality risk score has a potential application in therapeutic stratification, because it is associated with mortality from cancer, cardiovascular disease and all-cause mortality. It is important to assess the value of this score for other age-related outcomes (eg, cognitive performance).6,34,35
The most recent blood-based biological clocks include the DNAm PhenoAge of Levine et al,14 DNAm GrimAge of Lu et al37 and DNAmTL of Lu et al.38 The DNAm PhenoAge estimates multifactorial phenotypic age comprised of 10 measures, including chronological age, lymphocyte percentage, albumin and glucose levels.14 It can capture diverse age-related outcomes (eg, mortality and physical function). Acceleration of DNAm PhenoAge is moderately heritable and positively associated with genes upregulated with chronological age, such as factors of proinflammatory signalling pathways and antiviral response pathways, while it showed a negative association with genes downregulated with chronological age, including factors involved in transcriptional/translational machinery and DNA damage repair.14 Another multifactorial clock is DNAm GrimAge, which takes into account chronological age, sex, smoking and several DNAm estimators of plasma proteins. It can predict morbidity, mortality, age-related changes in blood cell composition and some diseases (eg, cancer).37 DNAm GrimAge acceleration is also associated with cognitive decline and neuroanatomical phenotypes.46 However, the DNAmTL clock, which correlates with both TL and age, outperforms DNAm GrimAge in its estimation of lifespan and has the potential to provide a mechanistic link between age-related diseases and environmental exposures or cell replication.38 The DNAmTL clock has significant value, because with age and an increasing number of cell replications, telomeres shorten, but measuring TL is challenging.
Notably, the DNAm PhenoAge outperforms chronological DNAm clocks in predicting survival, healthspan and physical function.14 By selecting CpGs that predict a multisystem measure of physiological deterioration with age, it captures the functional state of various tissues and organs more accurately than chronological age.5 The biological age measure of Zhang et al35 outperforms the Horvath and Hannum DNAm clocks in predicting all-cause mortality, as well as mortality risk by cancer and cardiovascular disease. However, the DNAm PhenoAge and Zhang clocks may be biased in tissues other than blood.14 Both tissue-specific and multitissue DNAm clocks could be useful in addressing a diverse set of questions (eg, multitissue clocks better reflect systemic aging).
DNAm clocks in cell culture
Both TL and multiple DNAm clocks have been reported to be reset to zero on reprogramming of embryonic stem cells and induced pluripotent stem cells.11,13,47,48 For Weidner clock,13 CpGs hypermethylated with age were hypomethylated in the reprogrammed cells (and vice versa). However, age-related DNAm changes were unaffected by replicative senescence in in vitro culture.13 Indeed, while DNAm changes associated with replicative senescence are acquired continuously with cell culture expansion, the ticking rate of the DNAm clock remains rejuvenated in pluripotent stem cells and only accelerates slowly on differentiation.49 Notably, the Horvath clock gives similar age predictions for both low and highly proliferative tissues, leading to the assumption that DNAm-age may be reflective of the epigenetic maintenance system. The reduced precision of DNAm clocks in cell cultures was solved by a recently developed DNAm clock that accurately measures the epigenetic age of fibroblasts, keratinocytes, as well as endothelial, blood, and skin cells.50 It offers the possibility of studying the underlying mechanisms of DNAm clocks and tests the anti-aging properties of new compounds in human cells.
Comparison of Genes in Different DNAm Clocks
Knowledge about aging mechanisms would enable the selection of the most suitable DNAm clocks for a specific task (eg, in a disease-context) and its biological interpretation for future clinical practices.51 For instance, it would be important to establish the age-related expression pattern of genes corresponding to clock-building CpGs (Supplementary Table 1). The CpGs of the 14 DNAm clocks are mapped to 1633 different genes, however the gene-set underlying DNAm GrimAge is unavailable. Based on the NHGRI-EBI Catalog of genome-wide association studies,52 106 of these loci are genetically associated with one of the major neurodegenerative diseases (ALS, AD, PD, or frontotemporal dementia), including genes responsible for Mendelian forms of PD (PARK2 and ATP13A2) or AD (PSEN1), each of which was included in 2 clocks.
Overall, only 173 genes overlapped in at least 2 DNAm clocks; however, some of them were incorporated in up to 6 clocks (KLF14), pointing to their significance in aging mechanisms. Chronological DNAm clocks appear to have more gene-overlap than biological clocks (Figure 2). This is likely because CpGs used in the biological clocks were selected to correlate with multisystem phenotypic measures, whereas CpGs in chronological DNAm clocks were selected to optimize the prediction of chronological age. As expected, the Zhang clock showed the most gene-overlap with other chronological clocks, because it is a near-perfect predictor of chronological age.33 In the assessment of the 9 chronological vs 5 biological clocks, the strongest gene-overlap was observed between Levine (DNAm PhenoAge) and Weidner clocks, which have been associated with several similar traits, including lifestyle factors, TL and some clinical measures.39 In addition, there is some gene-overlap between Levine clock and both Hannum and Horvath clocks, likely accounting for the fact that each of them has shown associations with similar phenotypes (eg, all-cause mortality and chronological age).
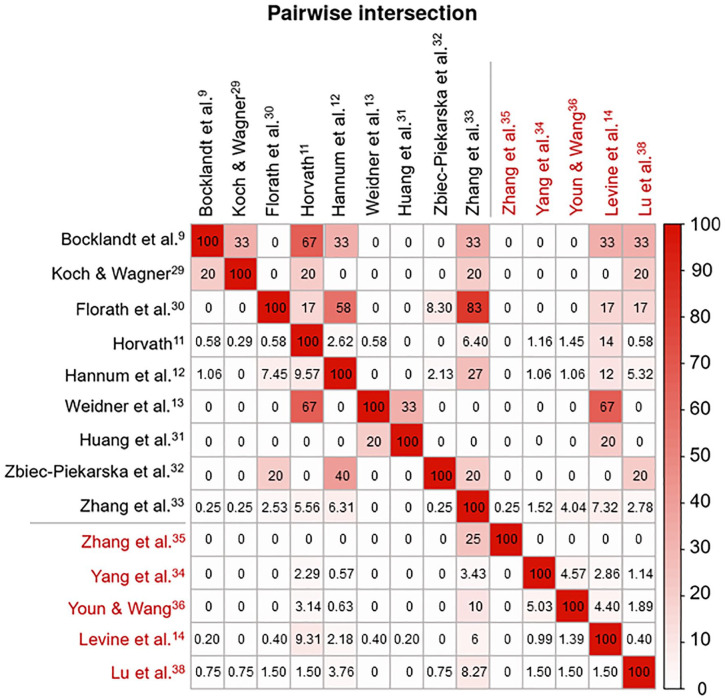
Gene-overlap among the 14 DNAm clocks. Matrix of pairwise intersections illustrating the relationship between different DNAm clocks based on the percentage of overlapping genes (biological DNAm clocks are indicated in red and chronological clocks in black). Each pairwise intersection, which matches 2 of the variables displayed on the horizontal and vertical axes, was calculated as the percentage of overlap between the genes of the different DNAm clocks and ranges from 0% to 100%. Colour depth indicates the strength of the relationship. Plot generated using the pairwise module of the Intervene Shiny App.53
Among the 28 top-overlapping genes (incorporated in at least 3 DNAm clocks), 21 genes display a consistent direction of age-related DNAm (Supplementary Table 2). For example, EDARADD is hypomethylated in 5 different DNAm clocks, suggesting it is upregulated with age, while the hypermethylation of KLF14 suggests it is downregulated with age. The greatest discrepancy was presented by the DNAmTL clock by Lu, which displayed the opposite DNAm direction in 4 of 8 genes shared with other clocks. The DNAmTL clock is rather unique, because it is a DNAm-based estimator of TL, and telomere attrition with its associated epigenetic changes is a distinct cellular process of aging.38,54 Hence, the list of 21 genes prioritized for functional studies and eventually for age-related therapies could be extended (Supplementary Table 2). In general, hypermethylation of age-associated genes results in a reduction of their expression; however, the link between DNAm and gene expression is not always straightforward, because elevated DNAm over the gene body can be accompanied by high gene expression.55
Functional annotation and gene-disease associations (using DAVID 6.8)56 revealed that 12 of the 28 top-overlapping genes are linked to neurodegenerative diseases (Supplementary Table 2). The most striking example is KLF14, integrated in 6 DNAm clocks. Age-related hypermethylation of KLF14 has been associated with abnormalities in DNA repair and cell cycle control in familial early-onset AD, and may be an epigenetic mechanism for the hypermethylation of TRIM95 (incorporated in 2 DNAm clocks) contributing to pro-apoptotic signalling in AD.55 Another example is the association between GRIA2 levels and AD brain pathology.57 Moreover, ASPA was associated with age of onset in Canavan disease,58,59 and the expression levels of PDE4 isoforms were linked to AD.60 Also, an association with VGF levels was reported in AD61 and ALS.62,63 Finally, reduced SCAP levels were linked to cognitive decline in an AD model.64 The observation that half of the top-overlapping genes are associated with neurodegenerative disorders reinforces the possibility that DNAm clocks could be used as disease biomarkers in clinical trials of neurodegenerative diseases.
Studies of DNAm Clocks in Neurodegenerative Diseases
Neurodegenerative diseases share common aberrant epigenomic patterns, which target genes involved in many cellular pathways.65 Multiple studies have used specific DNAm changes as disease biomarkers. For instance, increased DNAm in C9orf72 (in response to repeat expansion) leads to a downregulation of C9orf72 expression and correlates with disease onset and duration.66-68 Studies of neurodegenerative diseases revealed a link between clinical outcomes and DNAm-age acceleration, mainly using the Horvath multitissue clock.11
In ALS, studies of discordant identical twins reported that the ALS-affected twin had greater DNAm-age acceleration than the asymptomatic twin.69-71 Furthermore, in C9orf72 ALS patients (n = 46), every 5-year increase in blood-based DNAm-age acceleration was associated with a 3.2-year earlier age at onset.18 A study of genetically unexplained ALS patients (n = 249) also revealed a strong reverse correlation of DNAm-age acceleration with disease onset and survival.19 A 5-year increase in DNAm-age acceleration was linked to a 6.4-year earlier onset using blood collected at ALS diagnosis and 8.5-year earlier onset using CNS tissues, indicating further acceleration of DNAm-age by the end-stage of disease.
In AD, DNAm-age acceleration was associated with Aβ amyloid load and cognitive decline.15 Notably, 32 genes corresponding to clock-building CpGs are involved in the amyloid biological network (Supplementary Table 1). For instance, BACE1 and PSEN1, which encode Aβ generating β- and γ-secretase, respectively, are incorporated in DNAm PhenoAge.14 A study of the age acceleration measures of both Horvath and Hannum clocks revealed an association with several AD risk factors (eg, body mass index and cigarette smoking status).72 In addition, the Horvath measure correlated with cholesterol levels, while Hannum measure correlated with educational level. A recent investigation of the Horvath clock in a unique family with monozygotic triplets, 2 of whom developed AD in their mid-70s, revealed that the triplets’ DNAm-age was 6 to 10 years younger than their chronological age. In contrast, the triplet’s offspring with early-onset AD (at age 50) had a DNAm-age 9 years older than chronological age, indicating accelerated aging.73
Acceleration of the Horvath clock was also linked to PD, and an association was observed between PD and DNAm-based measures of blood cell types (patients showed more granulocytes but fewer helper T and B cells than controls).16 Furthermore, investigation of a PD family with the p.A53E mutation in α-synuclein showed that an earlier onset was accompanied by increased DNAm-age acceleration.74 Of note, the association between DNAm-age measures and disease traits may depend on the selected DNAm clock. In a study of multiple sclerosis, accelerated phenotypic aging was observed using DNAm PhenoAge, whereas the measures of the Horvath or Hannum clock did not differ from chronological age,51 which likely reflects the different aging mechanisms behind each DNAm clock. It illustrates the importance of choosing the proper age-estimator in disease-specific contexts for accurate interpretation of the results.
Overall, DNAm clocks could provide a better understanding of age-related mechanisms underlying neurodegeneration and help with designing an ‘extreme phenotype’ study/trial (eg, early vs late onset; and fast vs slow progression). Furthermore, DNAm modifiers may serve as potential therapeutic targets, which is supported by the observation that several loci included in DNAm clocks are genetically and/or functionally associated with neurodegenerative diseases (Supplementary Tables 1 and 2). Finally, it may be valuable to use several DNAm clocks together to combine their strengths for a specific study, which would require a better understanding of the aging mechanisms behind each clock and confounding factors influencing clock accuracy.
Confounders of DNAm Clock Accuracy
Genetic confounders and stability of DNAm changes
The methylome-wide profiles of identical vs fraternal siblings illustrated that DNAm levels are under strong genetic control.69,73 Hence, genetic differences could lead to the incorrect interpretation of age predictions and health outcomes. For instance, genetic variability partially accounts for the variance in DNAm PhenoAge,14 and ethnic differences could affect the aging rate of the Horvath clock.75 A longitudinal twin study found that Levine and Horvath clocks are moderately heritable and influenced by genetic background.76 Of note, 40 of the 353 CpGs in the Horvath clock could be lost due to rare variants (<1%) listed in the Infinium MethylationEPIC v1.0 B5 Manifest (http://webdata.illumina.com.s3-website-us-east-1.amazonaws.com/downloads/productfiles/methylationEPIC/infinium-methylationepic-v-1-0-b5-manifest-file-csv.zip). Furthermore, the rate at which DNAm changes with age could vary between individuals,77-79 and was associated with genetic loci affecting CpGs.80 In general, CpGs are the most mutable sites in the human genome, because methyl-C can spontaneously deaminate to T (35% of all coding mutations occur at CpG-sites).81 Hence, the impact of genetic factors on DNAm clocks should be taken into consideration.
It is important to separate DNAm changes intrinsic to aging from those that reflect environmental and lifestyle exposures. The influence of environmental and stochastic factors increases with age, causing larger interindividual DNAm variation in older individuals.77 This was supported by Horvath, Hannum and Levine clocks.82 Notably, the association between a higher body mass index and DNAm-age acceleration was reported in middle-aged but not in older individuals, suggesting that the link with some metabolic traits may vary throughout life.83,84
Analysis platform and preprocessing methods
DNAm-age clocks have been created using data from different platforms (eg, pyrosequencing or 27K, 450K and EPIC BeadChip arrays) (Table 1). Caution is needed when interpreting results using new or mixed arrays. For example, an underestimation of DNAm-age by Horvath clock was reported if the 336 CpGs (shared between 3 arrays) are used.85 Moreover, different tools for data preprocessing and analysis have been developed for each platform. A test of Horvath and Hannum clock on the EPIC array indicated that changes in the array and preprocessing methods can cause an increased median error in DNAm-age.86 Also, while certain normalization methods have been reported to be better than others (eg, peak-based correction and quantile-normalization for the 450K array),87-89 normalization methods should be carefully selected based on the type of study.86
Confounders related to cohort age range
The underrepresentation of certain age groups during the development of DNAm clocks may affect their predictive accuracy at different life stages, and suggests that chronological age should be included as a covariate when testing for associations with DNAm-age acceleration.44 Indeed, the rate of change in DNAm-age slows with age for Horvath and Hannum clocks90 and is fastest during development.5 Both clocks display a logarithmic pattern during the teenage years, and for this reason, Horvath clock has a log-linear transformation for samples from young individuals.45 Yet, the Horvath clock was found to give a systemic underestimation of age in tissues of elderly subjects. More accurate age estimators can be constructed by focusing on a specific age range and tissue.91 For example, the recent PedBE clock illustrated increased accuracy using a single tissue with a focused age range (0-20 years).91 In contrast to Horvath clock, the PedBE clock is expected to reflect developmental phenotypes related to growth, and the differences in the underlying mechanisms presented by these clocks can be traced back to the clock-building CpGs. As childhood is characterized by a rapid change in DNAm that is different from the methylome dynamics in adults, it is also important to develop a DNAm clock specifically designed for an older age range that could capture the influence of lifetime exposures.92
Tissue-related confounders
Due to the variance in DNAm status between different cells and tissues, correcting for cell and tissue composition is important for improving clock accuracy, although, in certain scenarios, it may cause biologically informative signals to be missed.5 Both tissue-specific and multitissue clocks are expected to hold important information on aging mechanisms. The multitissue markers are mostly located in evolutionary-conserved CpG islands, whereas tissue-specific markers are mostly mapped to CpG shore regions. Hence, different aspects of aging are being reflected by these 2 types of DNAm clocks, which should be taken into consideration for clock selection.
Discussion and Future Directions
A single best measure of biological aging does not exist, although some DNAm clocks outperform others for specific tasks. Each clock is built according to their unique training method, in which the age range, selected tissue(s), platform/statistical methodology, number of CpGs, and samples are of importance. Increasing the number of CpGs leads to a higher accuracy in the prediction of chronological age11,13,32,33; however, it could also cause the loss of informative disease-related CpGs.45 The little overlap in CpGs between the different clocks14 is likely reflective of diverse aging processes. For instance, CpGs in biological DNAm clocks were selected based on their correlation with multisystem phenotypic measures, in contrast to CpGs linked with chronological age. Notably, among the genes corresponding to clock-building CpGs, there are 28 genes incorporated in more than 3 DNAm clocks, most of which show a consistent direction of age-related DNAm in the different clocks (Supplemental Table 2). These genes could be prioritized for future age-related therapies and functional studies, including an evaluation of whether their expression levels influence disease presentation.
The various DNAm clocks reflect different aspects of a multidimensional aging process, including telomere biology, epigenomic instability, transcription, cellular differentiation and senescence.51 Some DNAm changes could be contributed to disease, while others may be a response to age-related decline, suggesting that DNAm clocks reflect a system maintaining epigenetic stability.11 Increasing DNAm variability over time may be the result of an accumulation of DNAm changes through cell division and DNA replication (eg, from errors by DNA-methyltransferases maintaining DNAm patterns on division).93 However, this explanation cannot account for the cell-/tissue-independent DNAm clocks that accurately predict chronological age even in postmitotic tissues (eg, brain). Chronological DNAm clocks could be driven by an increase in entropy, in which the epigenetic landscape smoothens with age and the ticking rate of the clock may reflect the general progression of low-/high-methylated CpGs towards a more intermediate DNAm level.12,13 Furthermore, they may reflect an evolutionarily selected programmed process, as such clocks remarkably accurately predict chronological age and display a link with tissue development; however, these observations are also consistent with the above-mentioned entropic model.6 In contrast, biological DNAm clocks are more likely to measure the variability between individuals in age-related functional decline and disease. Indeed, these clocks seem to be enriched for genes involved in age-related diseases, and the DNAm changes may affect disease progression through the regulation of these genes (eg, the Polycomb target genes in epiTOC).6,34
Importantly, measures of age acceleration could predict the therapeutic efficacy of drugs aiming to slow aging. For instance, a recent pilot study encouraged the use of the GrimAge predictor in a clinical trial intended to regenerate the thymus to prevent signs of immunosenescence.94 The application of DNAm clocks is especially important in neurodegenerative diseases, because aging is the strongest risk factor for all of them. However, it is unknown whether acceleration of DNAm-age is the cause or a consequence of neurodegeneration, which could be addressed by longitudinal studies (eg, assessing DNAm-age before and after disease onset). A longitudinal approach could also help identify more accurate measures of biological aging. For example, a study assessing 18 biomarkers of mortality at age 26, 32, and 38 revealed that worse healthspan outcomes were linked to a faster pace of aging.2 In the future, it would be important to have a longer follow-up period, use different ethnic cohorts and include the most recent biomarkers of age-related decline.1,2,95 However, a longitudinal study is only possible for easily accessible tissues (eg, blood).
In conclusion, each reported DNAm clock has its own strengths and limitations. Getting a better understanding of the aging mechanisms reflected by each clock is crucial for selecting the most suitable DNAm clock in a disease-specific context.45 It could also assist in determining which DNAm clocks may be beneficial to evaluate together in the same experimental setting to capture the complexity of the aging process and improve predictions of health outcomes with age. However, several confounders may affect the accuracy of DNAm clocks, which should be taken into consideration to correctly interpret the link between age predictions or health outcomes. Novel technologies could detect more CpGs in the human methylome to better track biological aging, and longitudinal measurements would be informative in evaluating the rate of epigenetic aging.1,2,96
Content retrieved from: https://www.ncbi.nlm.nih.gov/pmc/articles/PMC7376380/.